Introduction
Monitoring is the key service needed to gain insights into an infrastructure. It needs to be continuous and on-demand to quickly detect, correlate, and analyse data for a fast reaction to anomalous behaviour. The challenge of this type of monitoring is how to quickly identify and correlate problems before they affect end-users and ultimately the productivity of the organisation. Management teams can monitor the availability and reliability of the services from a high level view down to individual system metrics and monitor the conformance of multiple SLAs. The key functional requirements are:
- Monitoring of services
- Reporting availability and reliability,
- Visualisation of the services status,
- Provide dashboard interfaces,
- Sending real-time alerts.
The dashboard design should enable easy access and visualisation of data for end-users. APIs should also be supported so as to allow third parties to gather monitoring data from the system through them.
The key requirements of a monitoring system are:
- Support for multiple entry points (different types of systems can work together)
- Interoperable
- High availability of the different components of the system
- Loosely coupled: support API's in the full stack so that components are independent in their development cycles
- Support for Multiple Tenants, Configurations, Metrics and profiles to add flexibility and ease of customisation.
For EOSC there are two monitoring services already in place: EOSC CORE and the EOSC Exchange Monitoring Service. These two services are responsible to monitor the Core services (EOSC Core Monitoring) and the services onboarded to the Marketplace (EOSC-Exchange Monitoring).
High-level Service Reference Architecture
The service collects status (metrics) results from one or more monitoring engine(es) and delivers daily and/or monthly availability (A) and reliability (R) results of distributed services. Both status results and A/R metrics are presented through a Web UI, with the ability for a user to drill-down from the availability of a site to individual test results that contributed to the computed figure.
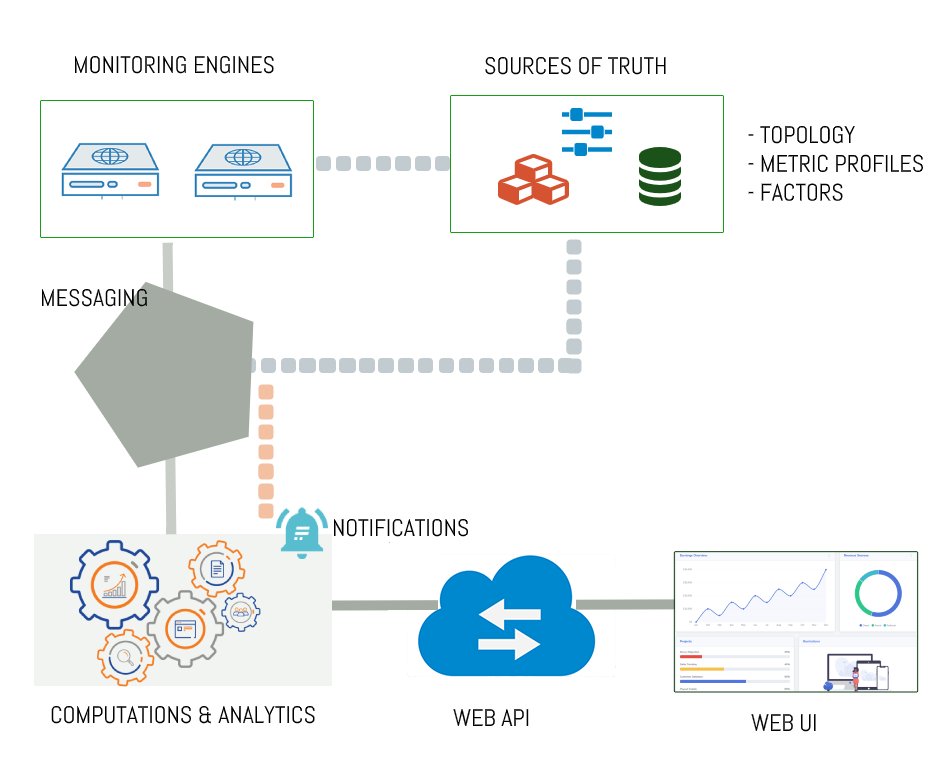
Figure 1. High level architecture of a Monitoring service
The main components of a monitoring service are depicted in the high-level architecture diagram and described below.
Monitoring Engine(s): This service component executes the service checks against the infrastructure and delivers the metric data (probe check results) to the Messaging Service.
Sources of Truth: The Monitoring system should support a number of connector plugins that are able to fetch topology, Metrics and Factors from various sources such as the CMDB and the Providers Portal. It also offers a Metric and Profile Management Component which is used in order to define checks (probes) and associate them to service types. Each grouping of checks and service types forms a profile.
Messaging: The monitoring system depends on a Pub/Sub Messaging Service to be in place, in order to facilitate the communication between its components.
Computations & Analytics: This component of the system should include computational job definitions for ingesting data, calculating status and availability/reliability and a management service to automatically configure, deploy and execute those jobs on a distributed processing engine for stateful computations. At the same time this component analyzes the monitoring results and sends notifications based on a set of rules, to inform the users (operators, NGIs) about the status of their services.
WEB API: Rest-like HTTP API service that provides access to status and availability/reliability results. It supports token based authentication and authorization with established roles. Results are provided in JSON Format.
WEB UI: The Web UI is the component used to store, consolidate and "feed" data into the web application. The global information from the primary and heterogeneous data sources is retrieved by means of the different plugins. The collected information is structured and organized within configuration files in the service and, finally, made available to the web application without the need for any further computations. This modular architecture is conceived in order to make it easy to add new data sources and to use cached information if a primary source is unavailable. The resulting data is exposed through a RESTful web service interface.
Definitions
In this section we explain the basic concepts of EOSC Monitoring.
A Tenant is an isolated instance of the ARGO Monitor service that relies on common components and provides the user with its own environment.
ARGO provides default UI and POEM URLs in following form:
- UI:
https://<tenant_name>.ui.argo.grnet.gr - POEM:
https://<tenant_name>.ui.argo.grnet.gr
In case custom ones are to be used, the customer is responsible for providing valid certificates and DNS aliases.
ARGO Monitoring service requires following topology information in order to monitor services:
- the services and service endpoints they are running,
- the way they are organised (e.g. groups of sites, groups of services),
- the service actors (owners, admins, contact points).
Topology can be further extended with attributes needed for individual probes (e.g. service port or URL, path to be used in case of storage services, e.g.).
Supported topology sources are:
- EOSC Resource Registry (Providers Portal):
Need to be extended to hold the following information for Monitoring.
-
Service unique Id
-
the service endpoints,
-
the way they are organised (service, service components),
-
the service actors (owners, admins, contact points).
-
EGI Configuration Database (GOCDB)
-
EUDAT DPMT
-
JSON feed in the predefined format.
A Metric is a chunk of code that checks specific functionality of a given service. For example a metric such as Portal-WebCheck runs on a site and checks if the HTTP connection responds correctly or not.
A Probe is a piece of code that implements single or multiple tests. The probe must comply with the guidelines for monitoring probes.
ARGO provides a registry of probes and metrics. New probes and metrics can be added to the registry with the support of the ARGO monitoring team.
A Metric Profile is used to associate a Service with the corresponding metrics.
An Aggregation Profile defines how to aggregate service statuses into higher hierarchical grouping (i.e. a service_group) status results. They are actually used to define logical rules on how to aggregate individual service status computations into groups.
The results of the metrics are computed, into EOSC Monitoring Service calculations, in order to conclude into the operational state of the service, during a specific period. In order to conclude about the operational state of the service, all or part of the metrics that check the service's functionality should be taken into account. In Metrics Profiles are included, for each service, these metrics whose results are considered to the computations of the service's state. For example, a service WebSite runs on host1.example.com. The WebSite service should operate properly, be accessible and some actions should be available such as downloading or uploading material (documents, images etc). Three metrics can apply on the service to check it's functionalities:
- Portal-WebCheck is a metric to check if the http responds
- http.download is a metric to check if download functionality operates well
- http.upload is a metric to check if upload functionality operates well
The service is assumed to operate properly if it is accessible and can support downloading material. Uploading material does not affect the state of the service (whether it is working properly or not). So in the Metrics Profile, the metrics Portal-WebCheck and http.download will be defined in order to be taken into account for concluding the status of the service.
Adopted Standards
- REST (https://www.ics.uci.edu/~fielding/pubs/)
- SAML2 (https://wiki.oasis-open.org/security/FrontPage)
- X509 (https://www.rfc-editor.org/info/rfc5280)
- Apache Avro (http://avro.apache.org/)
Adopted Protocols
- HTTPS (https://tools.ietf.org/html/rfc2818)
- Nagios Plugin API (https://nagios-plugins.org/doc/guidelines.html)
- ARGO API over REST API (http://argoeu.github.io/guides/api/)