Performance Data
Performance Data
Beyond providing monitoring of the status and the availabilty/reliability of services, the ARGO Monitoring Service is able to enrich the monitoring experience by providing insights on the performance of the services. Service performance monitoring allows service administrators to be proactive by tracking resource consumption, response times, and other performance metrics as well as predict potential issues so they can resolve problems before they impact end users. In ARGO Monitoring when we talk about performance monitoring we're referring to the continuous, systematic collection of data on network connection time response, on CPU load, memory, processes and disk usage, as well as any other category signifying service performance.
This can be achieved by using its analytics engine to analyze the actual data that accompany the stream of the collected Metric Data. Τhe prerequisite of performance monitoring is that the metrics used support actual data. Actual data is additional information about service behaviour that can be used in combination with threshold mechanisms to generate new metrics. Metric scripts can report actual data by following the Nagios guidelines for performance data. More infromation can be found here.
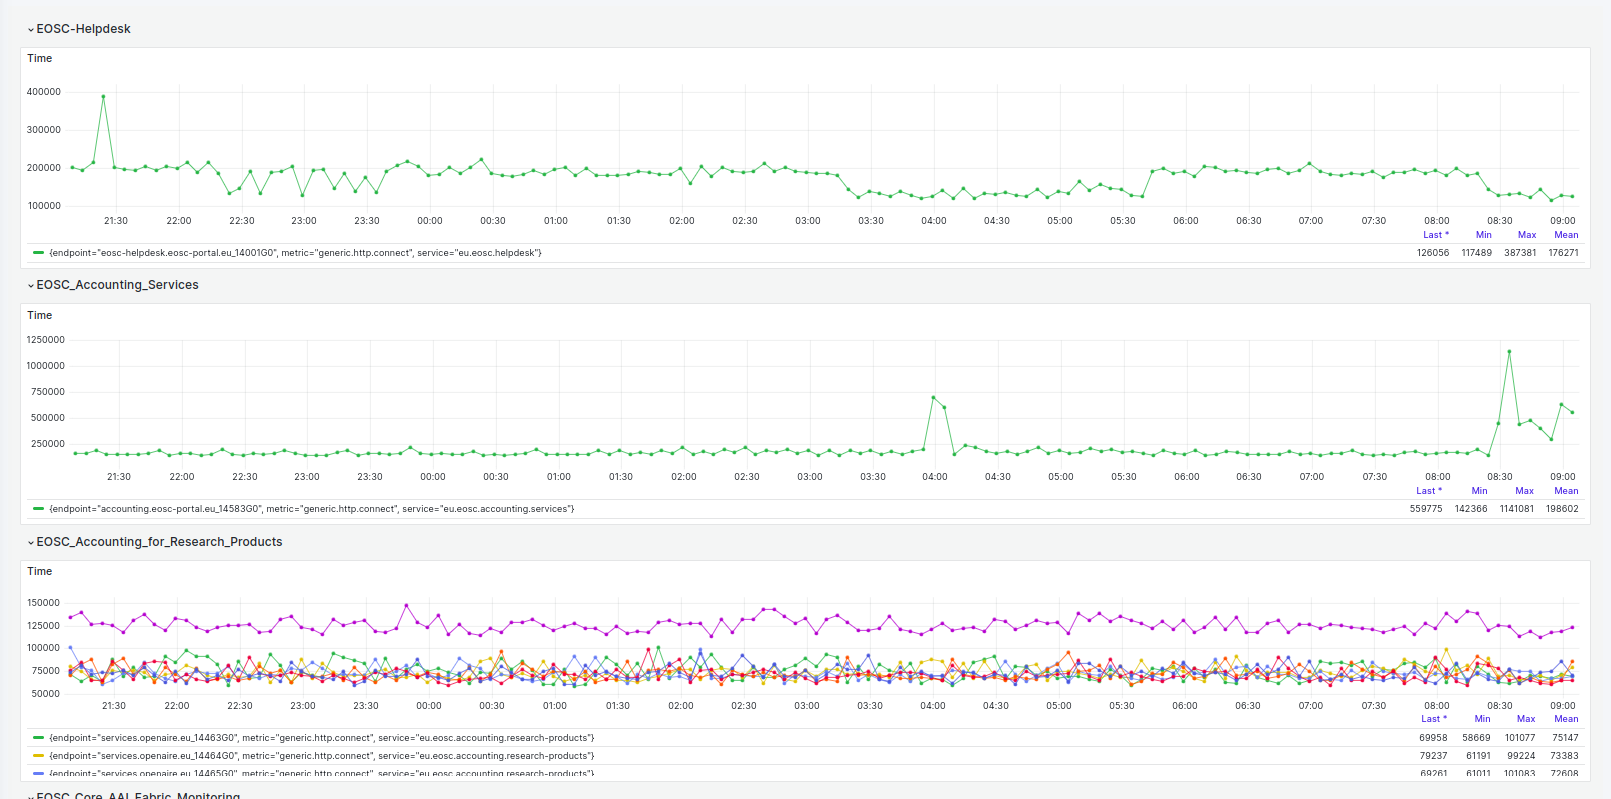
Graphs and timeseries are used to provide observability and data visualization, on the stored information, in order for the Argo Monitoring Service UI to be able to present the performance data. A mechanism is implemented internally to sort the performance data results by group, service in the ARGO Monitoring UI as presented:
Example
Performance Data for EOSC-Helpdesk service