Status Timelines
Status Timelines
Status Timeline is a report of the status of the monitored item/group of items, during the monitoring time. Knowing the timeline, provides information about the condition of the monitored item , helps to spot the most problematic metrics and decide about them. It is of major significance especially knowing when the monitored item is in a CRITICAL status, or it is in OK status
The calculations of the ARGO Monitoring service apply to all levels of the topology, grouping the monitored items based on the topology’s characteristics. Only items that are contained in the topology are included in the calculations, as they are defined by Topology Group, Topology Endpoint.
Metric Level - Monitoring a single check
The first step of calculations of the ARGO Monitoring service is concluding results in the level of the metric checks.
Example:
The metric check applies on a monitoring item with the following topology’s characteristics:
  "metric": "http.check",
  "hostname": "host1.example.com",
  "service_type": "Web-Site",
  "group": "group1"
The Metric Data records for this item could give information about the status as :
| timestamp | status |
|---|---|
| 2021-05-02T00:00:00Z | OK |
| 2021-05-02T03:00:00Z | OK |
| 2021-05-02T06:00:00Z | OK |
| 2021-05-02T09:00:00Z | OK |
| 2021-05-02T12:00:00Z | WARNING |
| 2021-05-02T15:00:00Z | WARNING |
| 2021-05-02T18:00:00Z | CRITICAL |
| 2021-05-02T21:00:00Z | OK |
The timeline result would be as shown in picture: 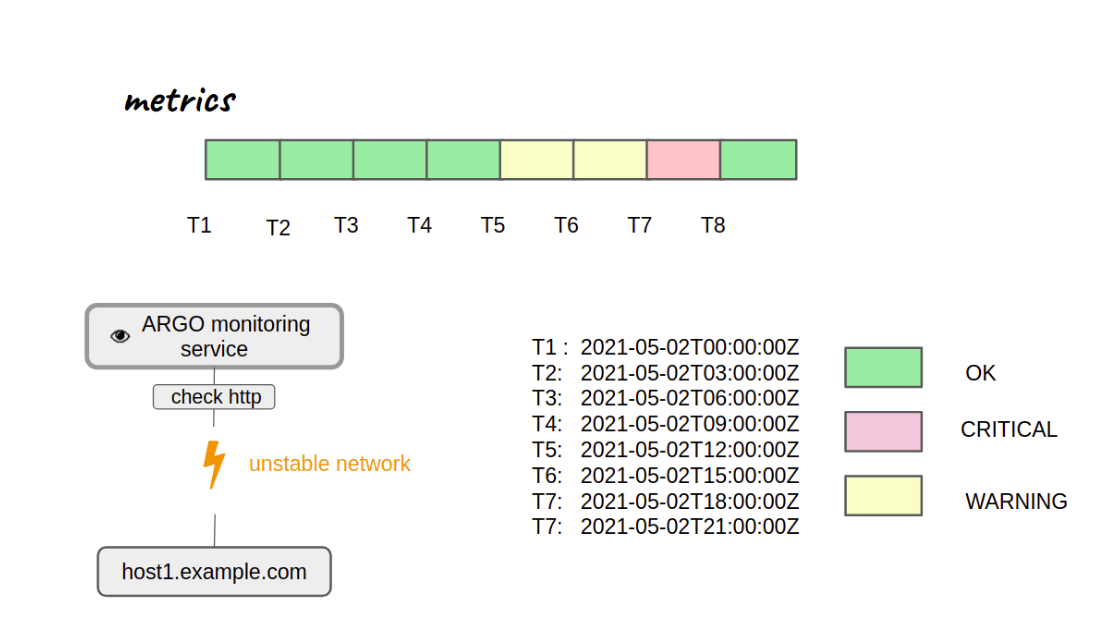
Endpoint Level - Monitoring a single host
The next level of the calculations is the endpoint level, producing results for a single host. A host includes multiple metric checks, so the Metric Data are grouped by the host. But not all metric checks of the host need to be included into the calculations. The ARGO Monitoring Service retrieves a Metric Profile report that defines the significant metric check. The Metric Data are filtered based on the given information and computations apply only to the metric checks defined in the Metric Profile reports. The Argo Monitoring service will combine the timelines of the metric checks and will combine the time interval and statuses into a new timeline. In order to combine the different statuses of a time interval and conclude into one status the ARGO Monitoring service retrieves an Operation Profile that defines all the possible status combinations. As Operation Profile includes a defined operation with a truth table of possible status combinations, the ARGO Monitoring service retrieves the operation that corresponds to the endpoint level from the Aggregation Profile
Example:
Here are three metric checks for the same host:
"metric": "http.check",
"hostname":"host1.example.com,
"service_type": "Web-Site",
"group": "group1" `
"metric": "http.download",
"hostname":"host1.example.com",
"service_type":"Web-Site",
"group": "group1"
"metric": "http.upload",
"hostname": "host1.example.com",
"service_type": "Web-Site",
"group": "group1"
But from the metric profile report only http.download and http.upload are defined.
As a result the ARGO Monitoring service will filter the Metric Data and will ignore the ones of the http.check metric check. The timelines of http.download and http.upload will combine with each other and produce the timeline of the endpoint host1.example.com, as shown in picture: 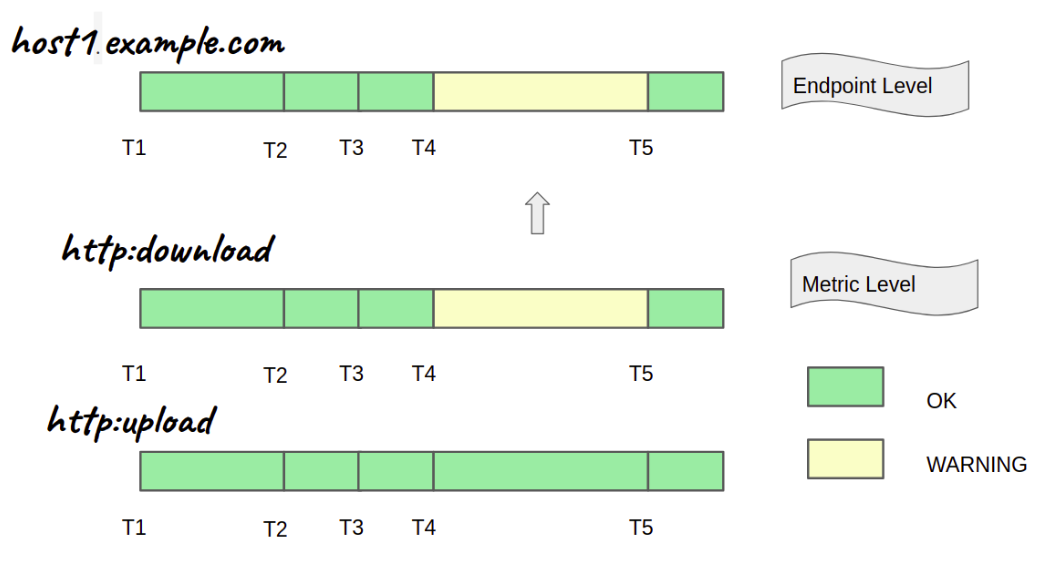
Service Level -Monitoring an entire service
The next level of the calculations is the service level, producing results for a single service. A service runs under multiple hosts, so the Metric Data are grouped by the service. The Argo Monitoring service will combine the timelines of the hosts that run the service into a new timeline.
Not all services are included into the calculations. ARGO Monitoring service filters the data to retrieve explicitly these services, as they are defined in Aggregation Profiles.
In order to combine the different statuses of a time interval and conclude into one status, the ARGO Monitoring service retrieves from the Aggregation Profile the operation for each service and knowing this, retrieves the status combination of this operation from the Operation Profile.
Example :
The monitored service Web-Site operates under 3 hosts : host1.example.com, host2.example.com, host3.example.com. In order to decide that the service operates successfully it should run successfully to all hosts. ARGO Monitoring Service groups the timelines by the service Web-Site and would create status timelines for the service by combining the individual host status timelines.
The way that the individual hosts’ status timelines are combined to produce the final result for the service is described in the Aggregation Profile. The Aggregation Profile defines the AND or OR way to aggregate the individual hosts’ status timelines in order to compute the final timelines. The function AND, OR and the way they are used for the computations are defined in the Operations Profile.
The timeline result would be as shown in picture: 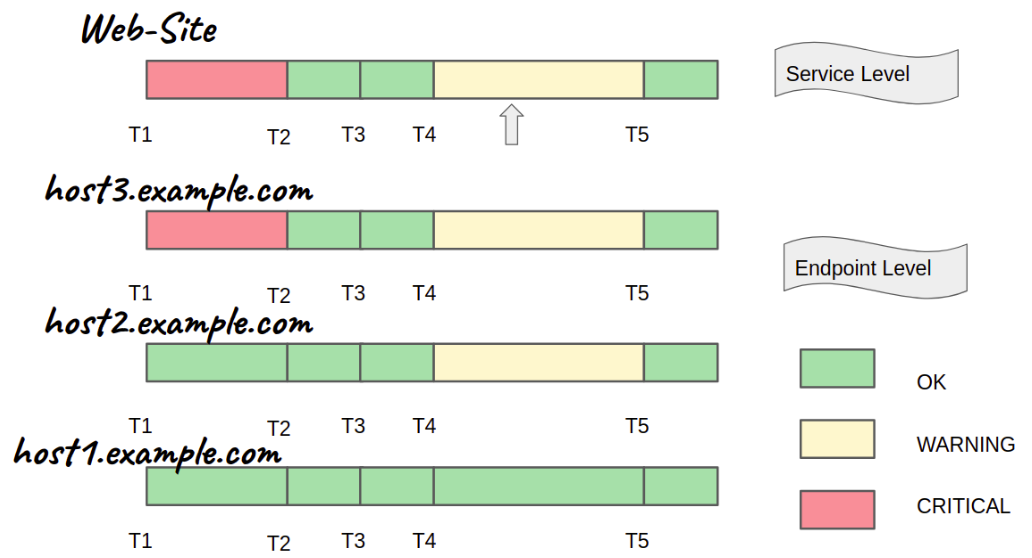
Monitoring an entire group
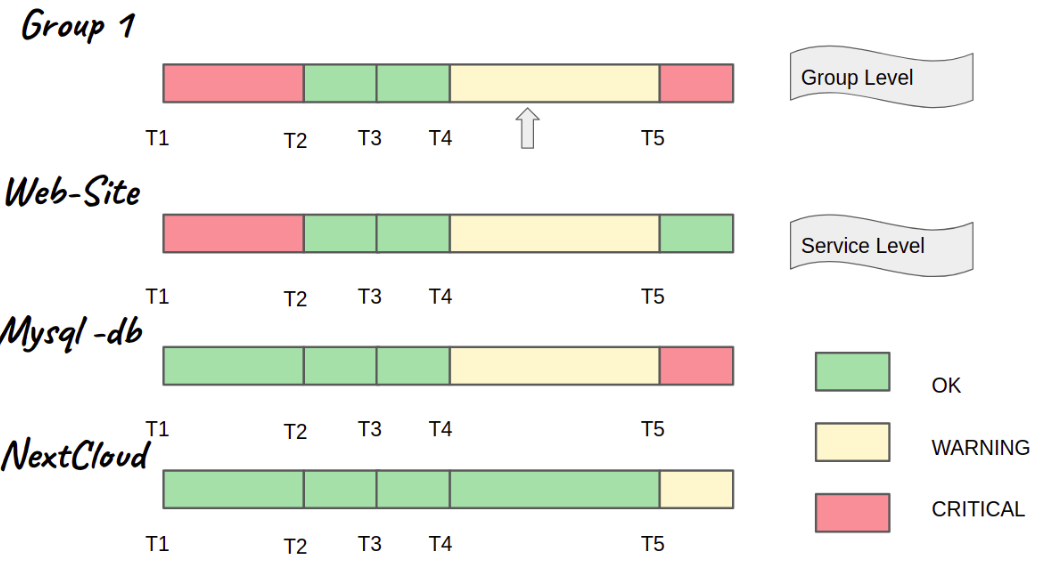
A group might contain a number of service offerings, such as a Web-Site, a mysql-db, a NextCloud etc. The services’ timelines can be combined and concluded into a status timeline for the group. A group may represent a whole project or a group of services that work together to offer an operational solution to the users. This kind of grouping could also represent data infrastructures with geographical designation, such as a specific data center etc. The way that these services are combined to produce the final result for the group is described in the Aggregation Profile.
Example :
In the previous example we described how the ARGO Monitoring Service is monitoring the service Web-Site . Let’s assume we have the mysql-db service for storing data, and the NextCloud service for storing files.
A project is using these 3 services for its users. In order for the service offering to be operational, all of these 3 services should run without problems. In order to monitor them we put them in a group named by the project they belong to. ARGO Monitoring Service would create status timelines for the project by combining the individual service status timelines.
The way that the individual service status timelines are combined to produce the final result for the group is described in the Aggregation Profile. The Aggregation Profile defines the AND or OR way to aggregate the individual service status timelines in order to compute the final timelines. The function AND, OR and the way they are used for the computations are defined in the Operations Profile.
The timeline result would be as shown in picture: