Metrics
Metric is a procedure which checks specific functionality of a given service, i.e. single measurement (e.g. generic.http.connect, generic.certificate.validity).
Since tenant users are not allowed to create metrics themselves, metric templates are created on SuperAdmin POEM which are automatically imported to tenant POEMs when the metric profiles are updated.
List of metrics
Metrics page is accessible through menu on the left side. The layout is shown in the image below.
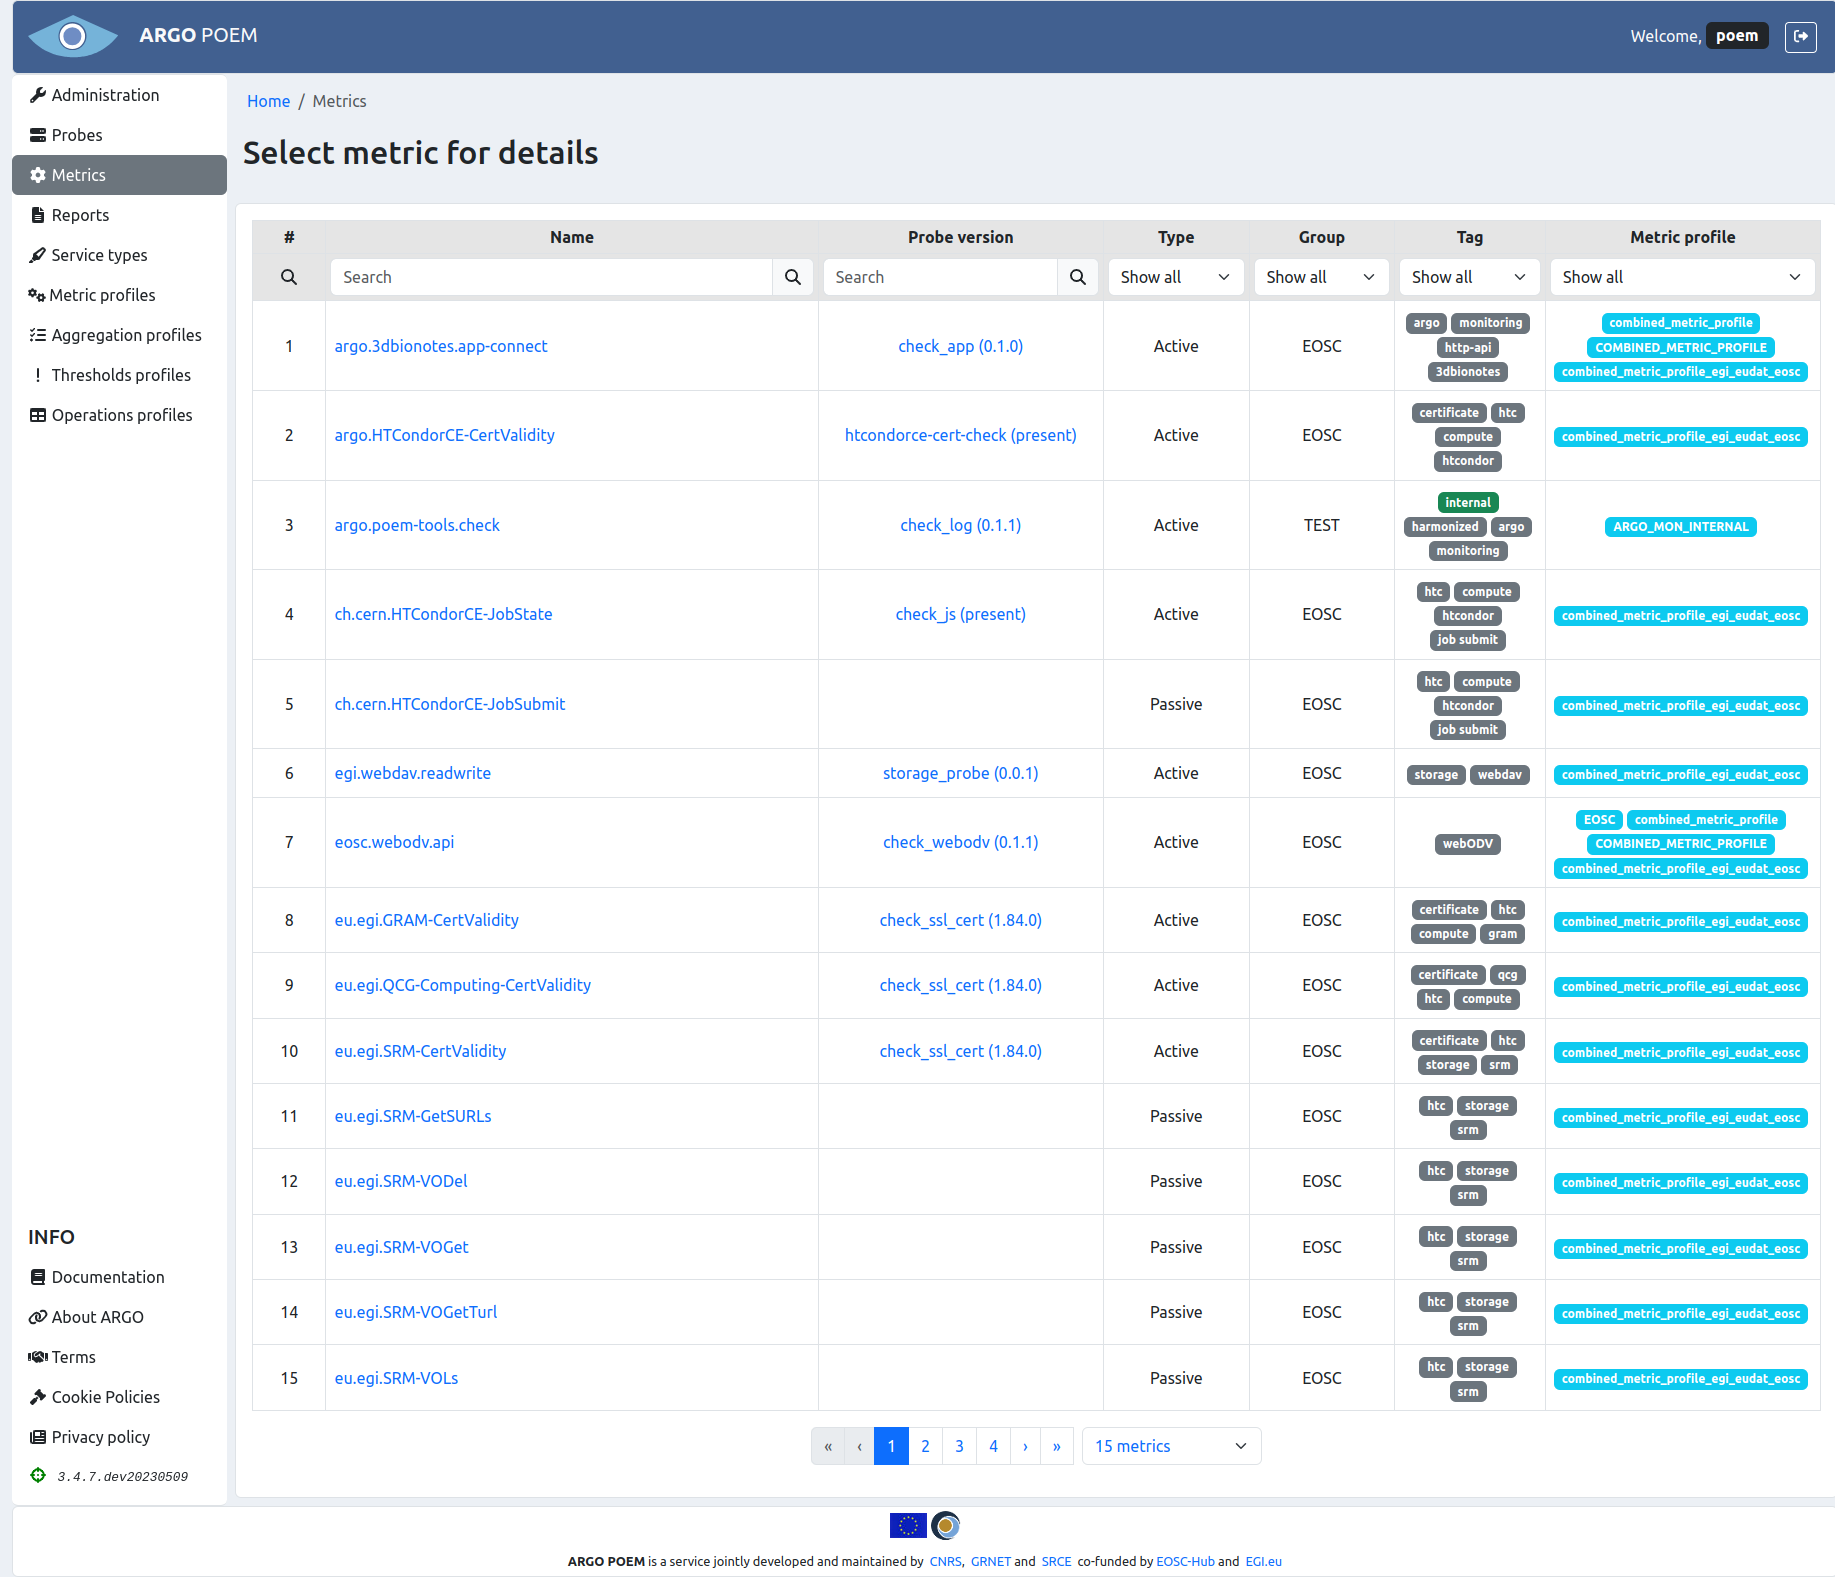
Metrics can be filtered by name, probe, group, type (active or passive), and tag. Any particular metric can be accessed by clicking its name. Also, one may see probes associated to metrics by clicking probe's name.
Metric details
Particular metric's page is shown in the image below.
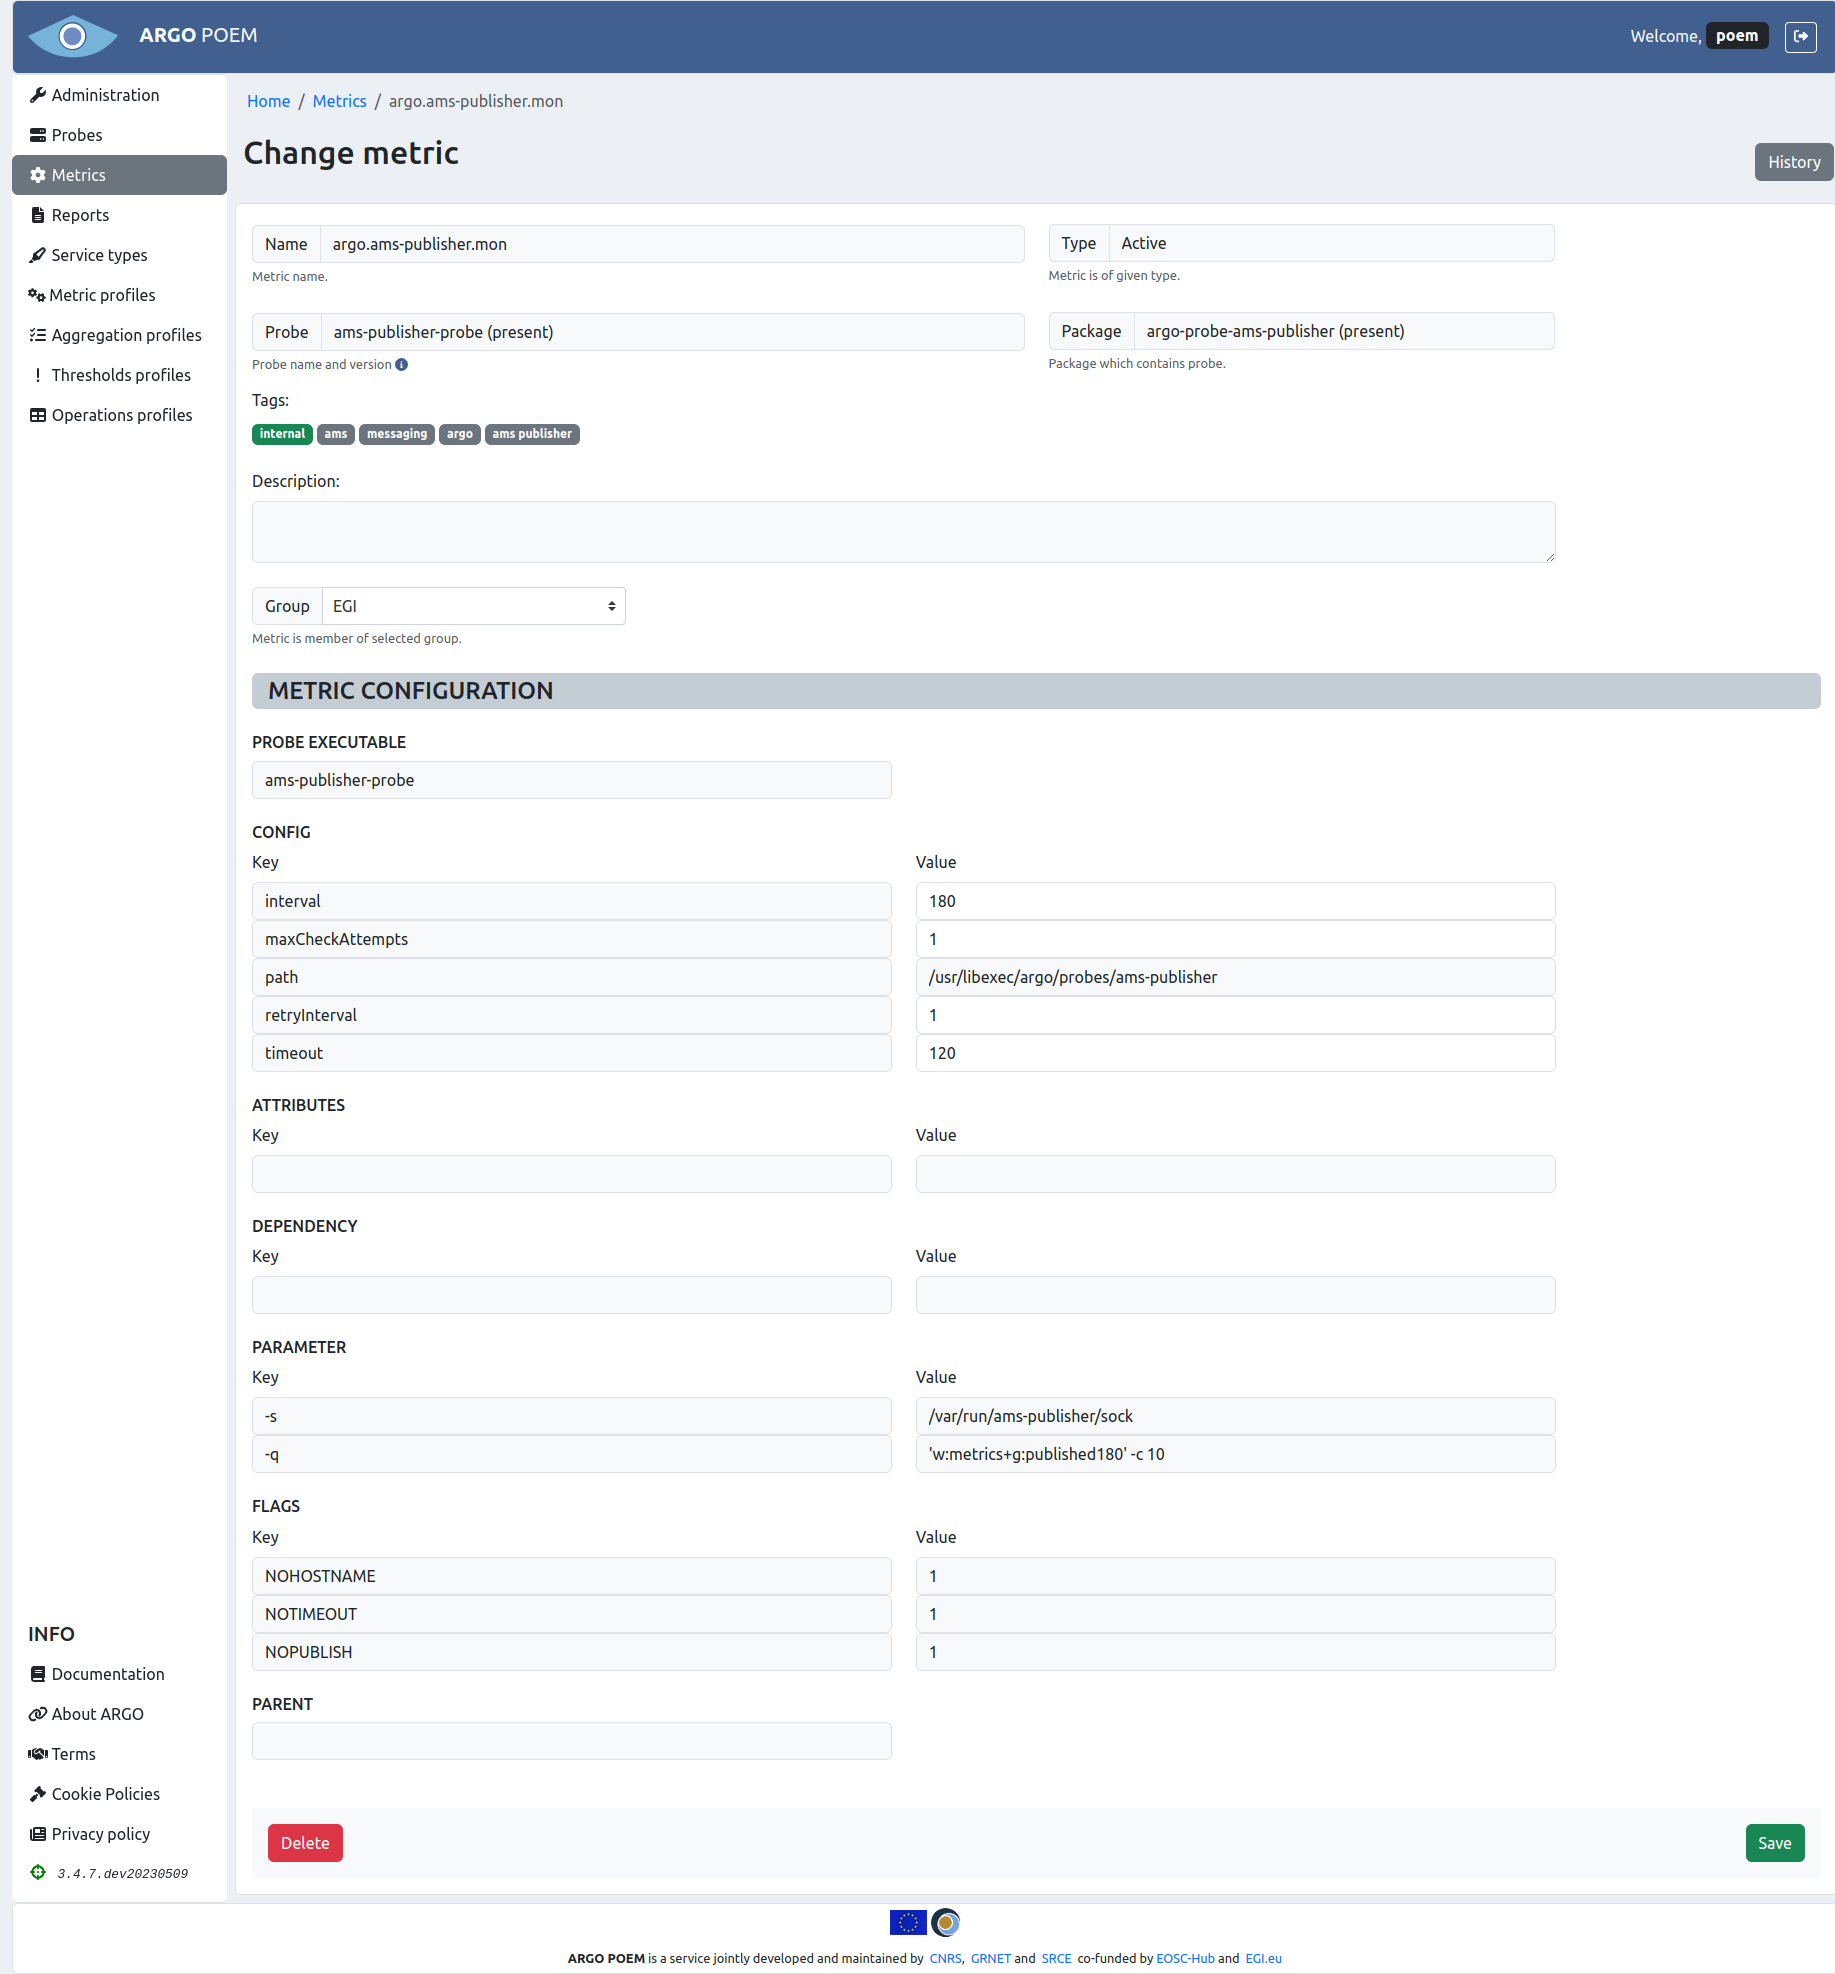
Most of the fields are disabled. Tenant users are only allowed to modify four of the configuration values and group. Users may only choose among groups that are associated to them. Exception to this rule are users with superuser permission, they can pick any existing group.
Fields descriptions are given in metric template documentation.
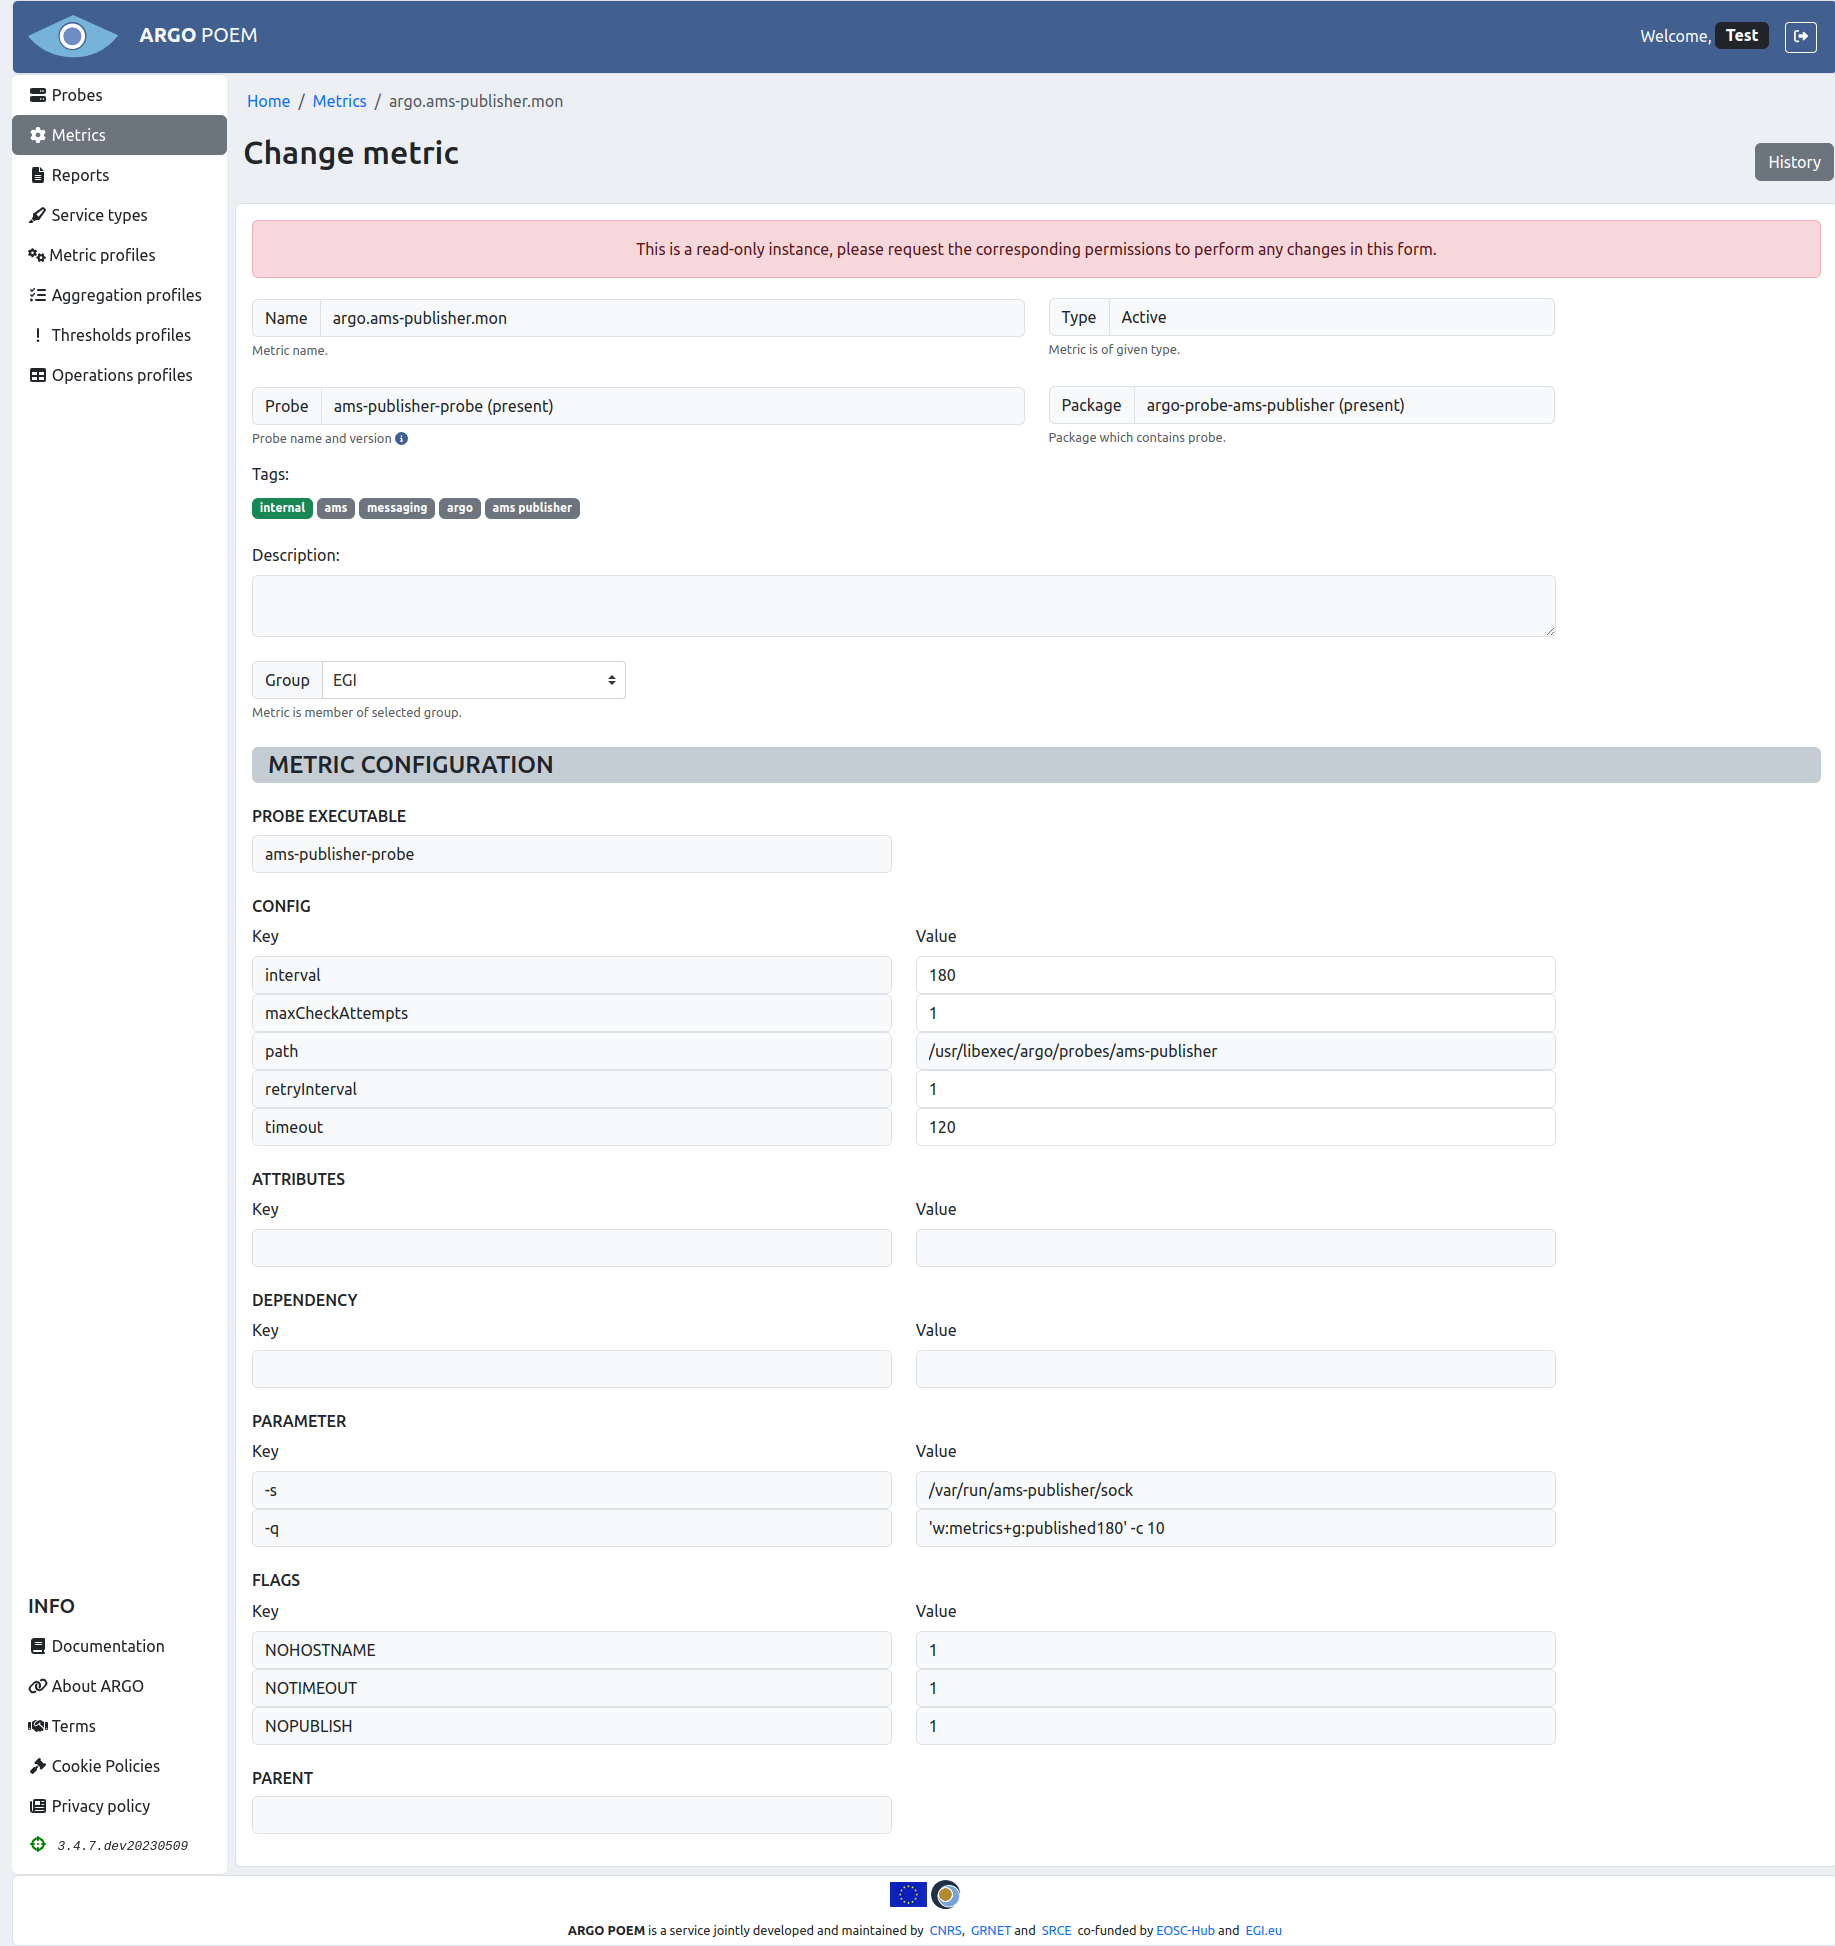
In case user has no permission to modify the metric, there is going to appear a warning message on top of page, as shown in image below.
Metric history
By clicking History button, user can see all the changes made to the metric, when they were made, and by whom.
Adding new metrics
Tenant users cannot add new metrics by themselves. Metrics are automatically imported from available metric templates when metric profiles are updated. If none of the metric templates is satisfying, the user will have to ask a super admin to add new metric template to SuperAdmin POEM.