Tenant Dashboard
The Tenant Dashboard serves as the primary operational interface for monitoring service status, identifying underlying infrastructure issues, and reviewing availability trends.
By default, the dashboard is restricted to authenticated Tenant Administrators and Viewers, unless explicitly configured to be public. It is designed for hands-on operational use, incident investigation, and proactive troubleshooting.
It provides:
- A detailed operational view of all monitored services within a tenant.
- Current Service(s) visibility.
- Early detection of service degradation or missing monitoring data.
Dashboard Layout & Structure
The dashboard interface is divided into a top-level alert banner followed by three distinct functional areas:
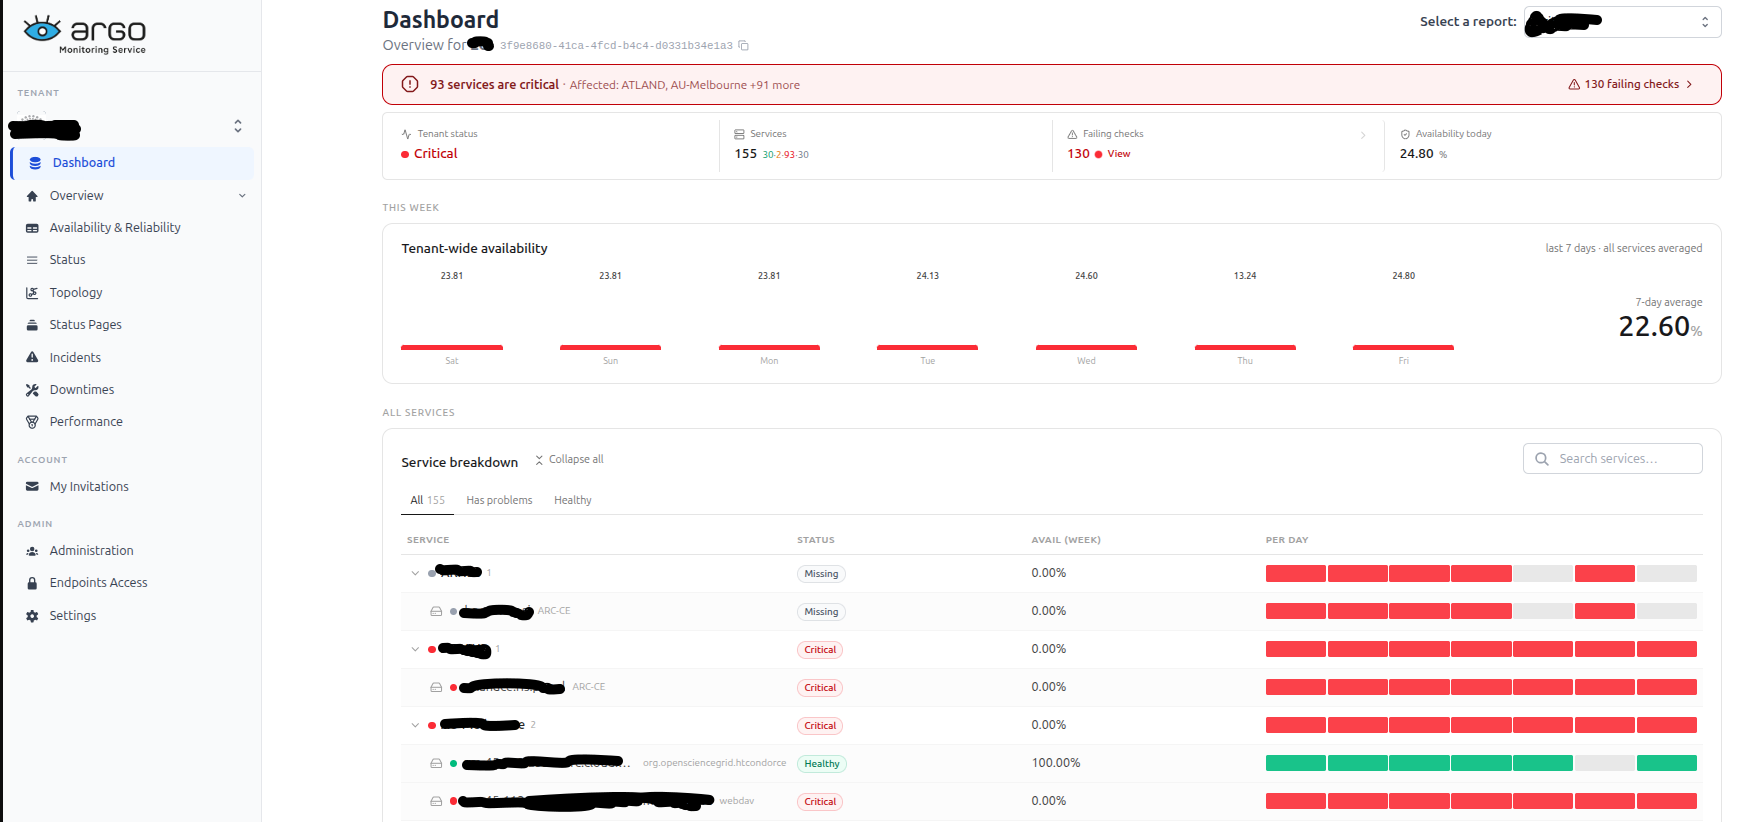
Top Alert Banner
Displays immediate, high-priority notifications regarding severe infrastructure or service disturbances. For example, if critical problems occur, a prominent red alert bar flags the total number of critical services and specifies the names of the affected services.

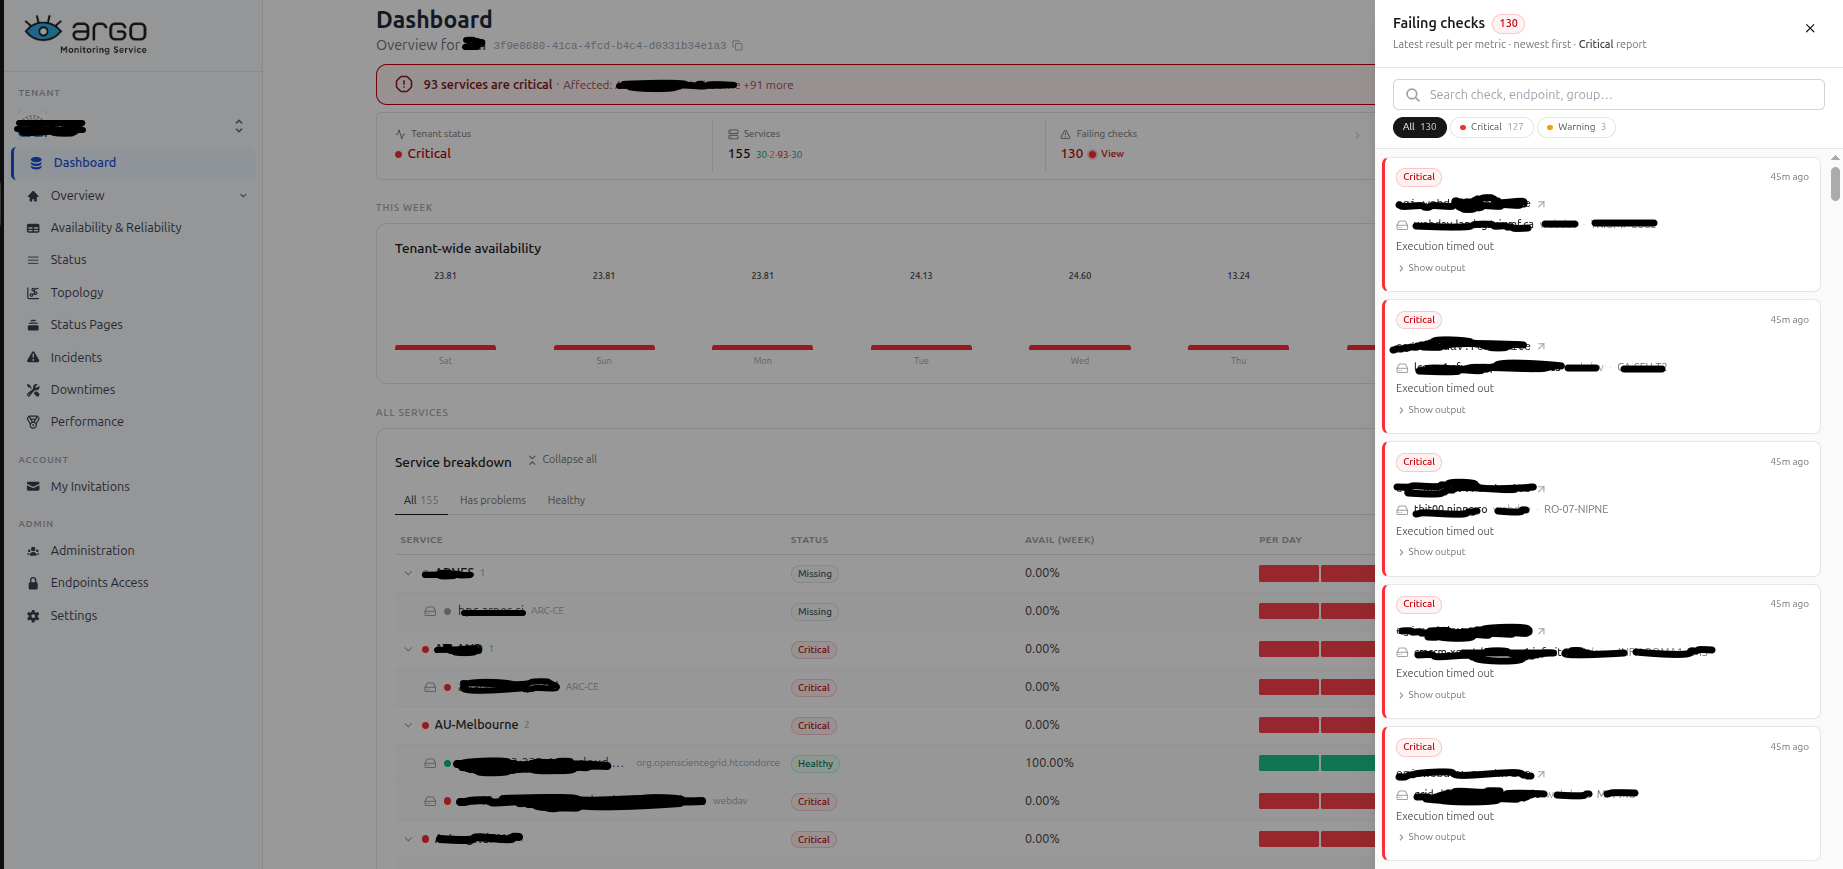
If the failing checks is clicked on the right , there are displayed the latest failing checks in details

The Dashboard includes a Downtimes banner that provides an overview of all ongoing and upcoming downtimes for the tenant, as shown in the image below. For more details, see the Downtimes section.

Hover over the banner to view the services currently affected by downtime, along with the scheduled start and end times for each downtime period.
The Dashboard also includes an Incidents banner that provides an overview on incidents. For more details, see the Incidents section.
Hover over the banner to view the incident's details.

Real-time Operational Summary
Directly below the banner, three dedicated widgets provide a snapshot of the tenant's current execution state:

- Tenant Status: An indicator reflecting the overall infrastructure health (e.g., Critical, Warning, or Healthy).
- Services Metric: The total number of monitored services, color-coded to show exactly how many are currently healthy, warning, or experiencing critical issues/unknown states.
- Availability Today: Displays the real-time, aggregated availability percentage of the entire infrastructure for the current day.
Tenant-wide Availability Overview
A seven-day historical overview showing the tenant-wide availability for each day, together with the overall seven-day average.

It enables administrators to review:
- Daily availability percentages.
- The overall running 7-day average across all combined services.
Service Breakdown
The Service Breakdown section provides detailed per-service information.
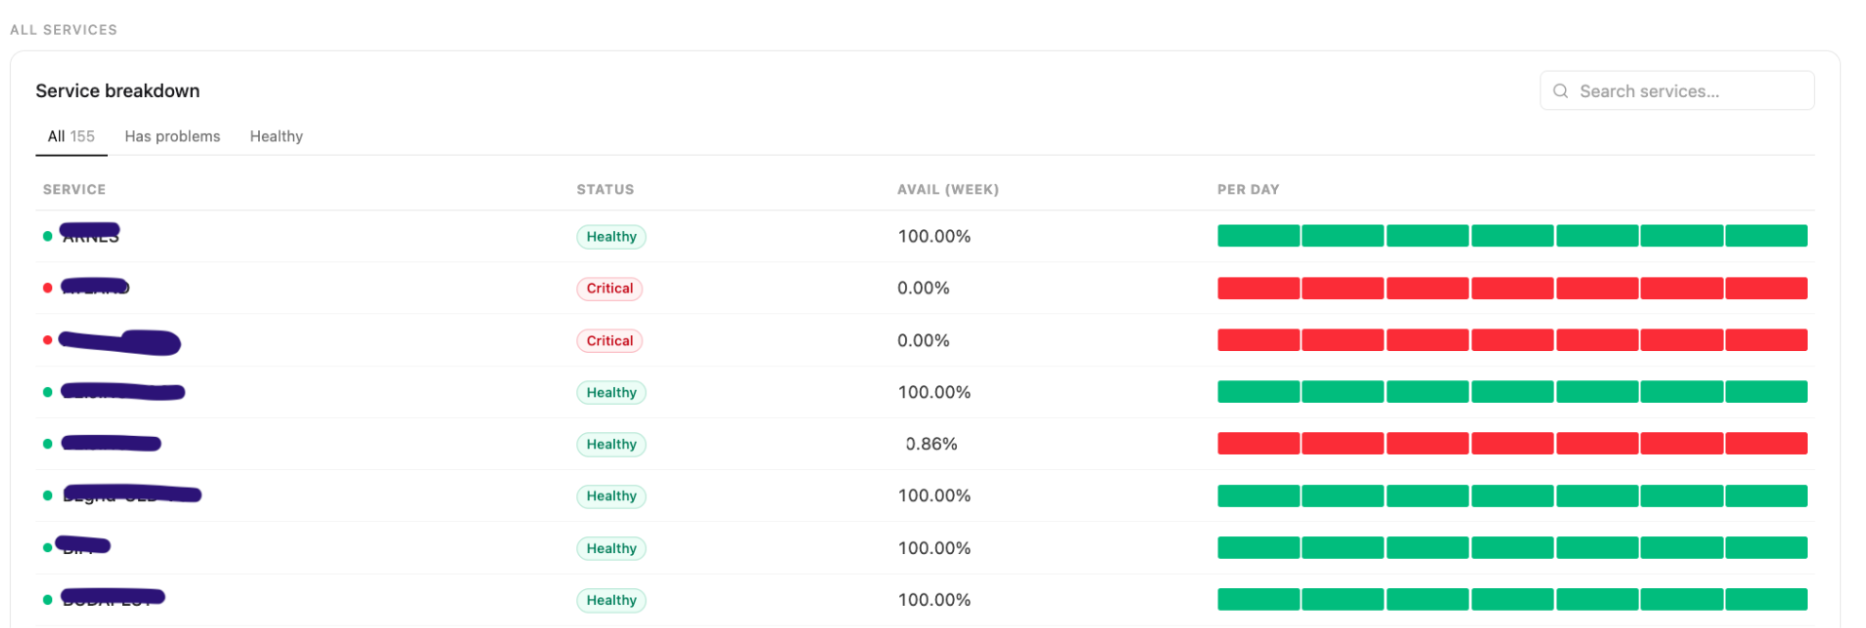
A granular list detailing individual service performance. For each service item, the interface maps out:
- Service Name: The specific name of the resource.
- Status: A color-coded indicator for the live status.
- Avail (Week): The trailing weekly availability percentage.
- Per Day (Last 7 Days): A visual block timeline mapping out daily status over the past week.
Tabs of (has problems, healthy) are also available, grouping services by status to highlight those requiring attention.
Finally, a search box at the top right of the Service Breakdown sessions is available and allows the user to search individual services.