Introduction
Welcome to the ARGO Monitoring Service UI User Guide
The ARGO Monitoring Service UI is the operational interface for monitoring your infrastructure / services. This guide serves a dual purpose: it is both (a) a practical guide for navigating the service’s features and (b) an introduction to the core concepts, terminology, and architecture of the monitoring service. As you navigate through each section, you will gain an understanding of the functionalities of the Monitoring Service and how to utilize it effectively through its modern and comprehensive user interface.
What is the ARGO Monitoring Service?
The ARGO Monitoring Service is tasked with observing other systems, services, and/or resources to collect operational data and track their status, availability, and reliability in real time and at a granular level. The main objectives are to continuously track the health and performance of electronic infrastructures and to immediately trigger alerts upon detecting functional or operational errors and other anomalous behaviours. Depending on the scale of the electronic infrastructure and the number of services under observation, a reliable, timely and automated monitoring tool can significantly improve incident awareness and response times, allowing for proactive planning and effective resolution before escalation.
The ARGO Monitoring Service goes a step further by providing a centralized, modern, and comprehensive web User Interface, designed for intuitive administration. Thus, users can comfortably access the details and status of all monitored items, navigate and update their infrastructure’s topology with ease, as well as review historical data at monthly, weekly, or daily granularity, to gain valuable insight into any item’s health and performance over time.
The ARGO Monitoring Service UI
The demo instance of the ARGO Monitoring Service can be found here. Keep in mind that this guide presents sections as available to different types of users (from an unauthorized user to a super administrator who can perform all actions), so you may need to first ensure your access rights and current or potential role within the service based on.
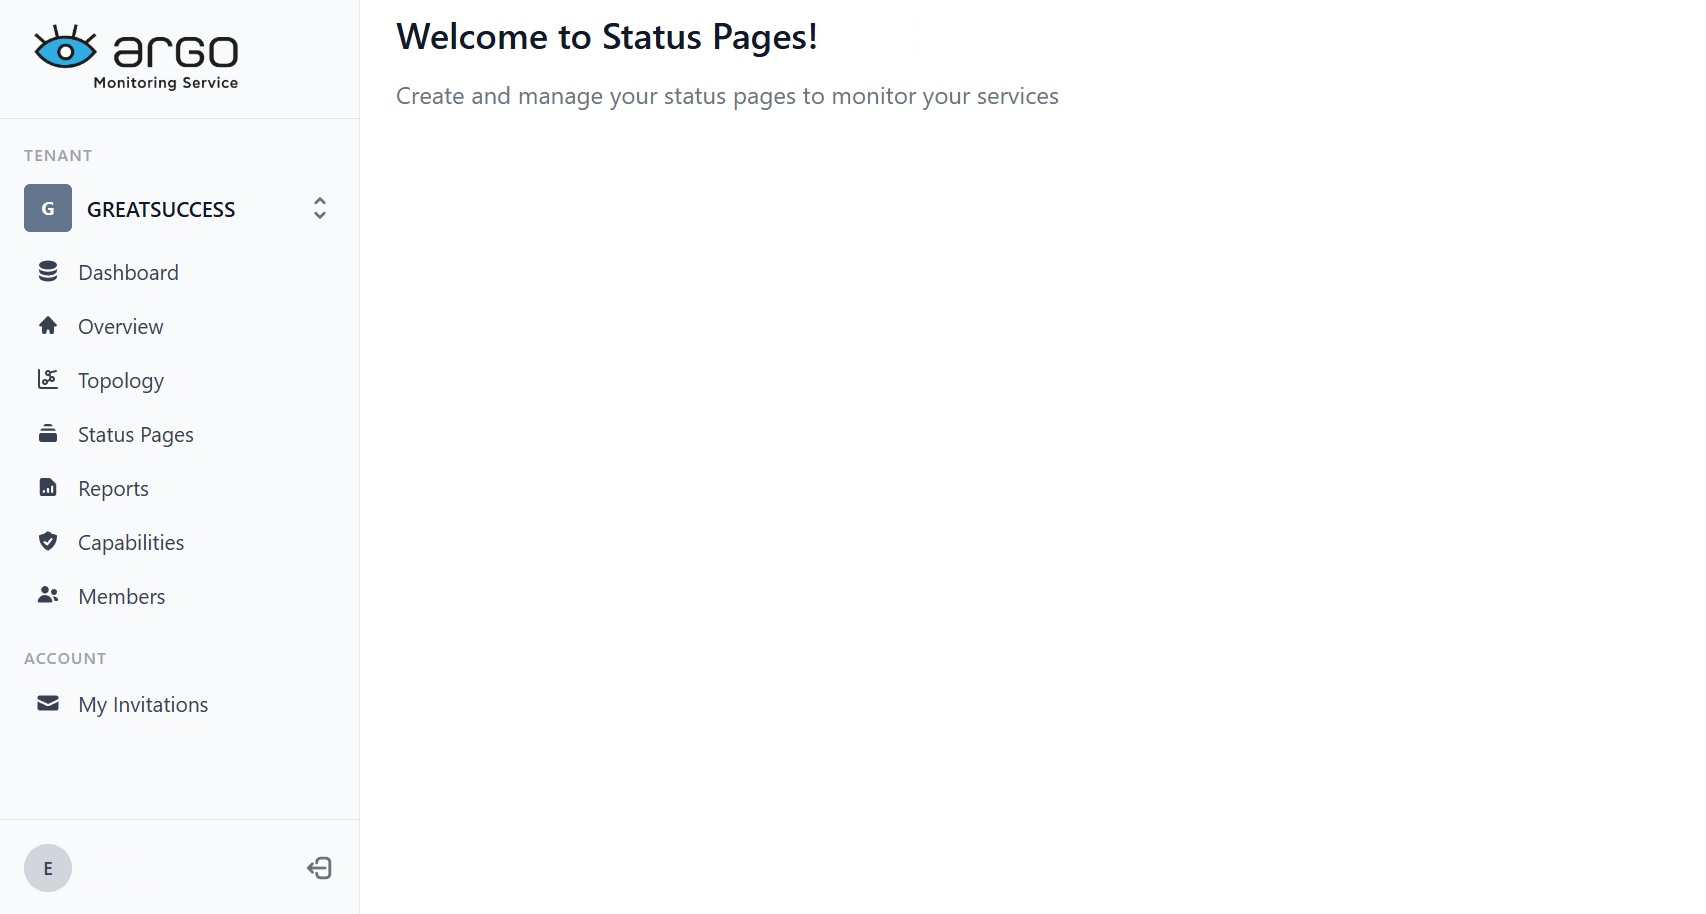
The Welcome page is the first screen displayed after logging in. It provides access to all available modules / features through the navigation menu on the left.
This page consists of:
- Tenant Selector – It displays the active tenant and enables switching to others based on the user's specific access rights and permissions.
- Navigation Menu – Provides access to the following sections:
- Dashboard
- Overview
- Topology
- Status Pages
- Reports
- Capabilities
- Members
- Account Section – Contains the My Invitations page.
- Account Profile – Located at the bottom-left corner.
How should you read this guide?
The ARGO Monitoring Service User Guide is organized around the service’s features as listed above, providing you with step-by-step instructions for using them. At first, certain concepts and terminologies may appear unfamiliar or out of context. For this reason, you may find it useful to briefly review the Glossary before continuing with the guide, or keep it close by and consult it as you move along. There is no need, however, to memorize terms as the guide gradually provides you with definitions and contextualizes all core concepts.