Downtimes
Not every service disruption is a surprise. Sometimes the best way to keep a service healthy is to take it offline on your own terms. ARGO Monitoring supports scheduled maintenance, allowing service providers to plan ahead, while ensuring that users know what to expect before any interruption occurs.
In ARGO Monitoring, planned maintenance periods are referred to as downtimes. A downtime represents any period during which a service is expected to be unavailable. By scheduling maintenance in advance, providers can suppress unnecessary alerts and notifications, keeping monitoring results accurate, while giving users clear visibility into upcoming service interruptions.
A downtime is considered scheduled when it is registered in ARGO Monitoring at least 24 hours before the maintenance begins. If the maintenance is announced less than 24 hours in advance, the resulting interruption is treated as unscheduled downtime (an incident).
Downtime may be scheduled for a variety of reasons, including:
- Hardware failure — physical equipment malfunction
- Software/logic failure — issues in the systems controlling equipment
- Interconnecting equipment failure — cables, facilities, routers, and similar infrastructure
- Transmission issues — wireless, microwave, or satellite links
- Capacity limits — a system reaching its operational limits
What is a Downtime?
A downtime is a scheduled, planned period during which a service is expected to be unavailable or degraded — typically due to routine maintenance, upgrades, or other necessary work. Unlike an incident, which is unplanned and reported reactively, a downtime is declared in advance by an authorized user, tied to one or more services, and communicated to users before it begins.
Core Concepts
Why Use Downtimes?
- Avoid false alarms — scheduling a downtime in advance prevents unnecessary or unwanted notifications from being triggered during a period of expected service interruption.
- Keep monitoring data accurate — availability, reliability, and uptime calculations can exclude scheduled downtime periods, so your metrics reflect genuine service problems rather than planned work.
- Set clear expectations — users and subscribers know exactly when a service will be affected and for how long, reducing confusion and support requests. This reinforces confidence.
- Enable safe maintenance windows — teams can perform necessary upgrades or fixes without the pressure of live monitoring alerts firing during expected work.
View in the UI
A downtime (or scheduled maintenance event) consists of the following attributes:
- Name: A short, descriptive title for the downtime or maintenance event.
- Severity: Indicates the impact level of the event. Possible values are Outage or Warning.
- Message: A detailed description providing additional information about the downtime.
- Scheduled At: The date and time when the downtime is scheduled to begin.
- Completed At: The date and time when the downtime ended or was marked as completed.
- Services: The list of services affected by the downtime.
- Timestamp: The date and time when the downtime record was created in the system.
- Classification: Indicates whether the downtime is Scheduled or Unscheduled. A downtime is considered Scheduled if it is created at least 24 hours before its start time; otherwise, it is classified as Unscheduled.
List of downtimes
The Downtimes page displays all active, upcoming, and completed downtime events.
For each downtime, the following information is displayed:
- Name of the downtime
- Scheduled date and time
- Severity label (Outage or Warning)
- Classification label (Scheduled or Unscheduled)
Each downtime also provides Edit and Delete actions, allowing you to modify or remove it.
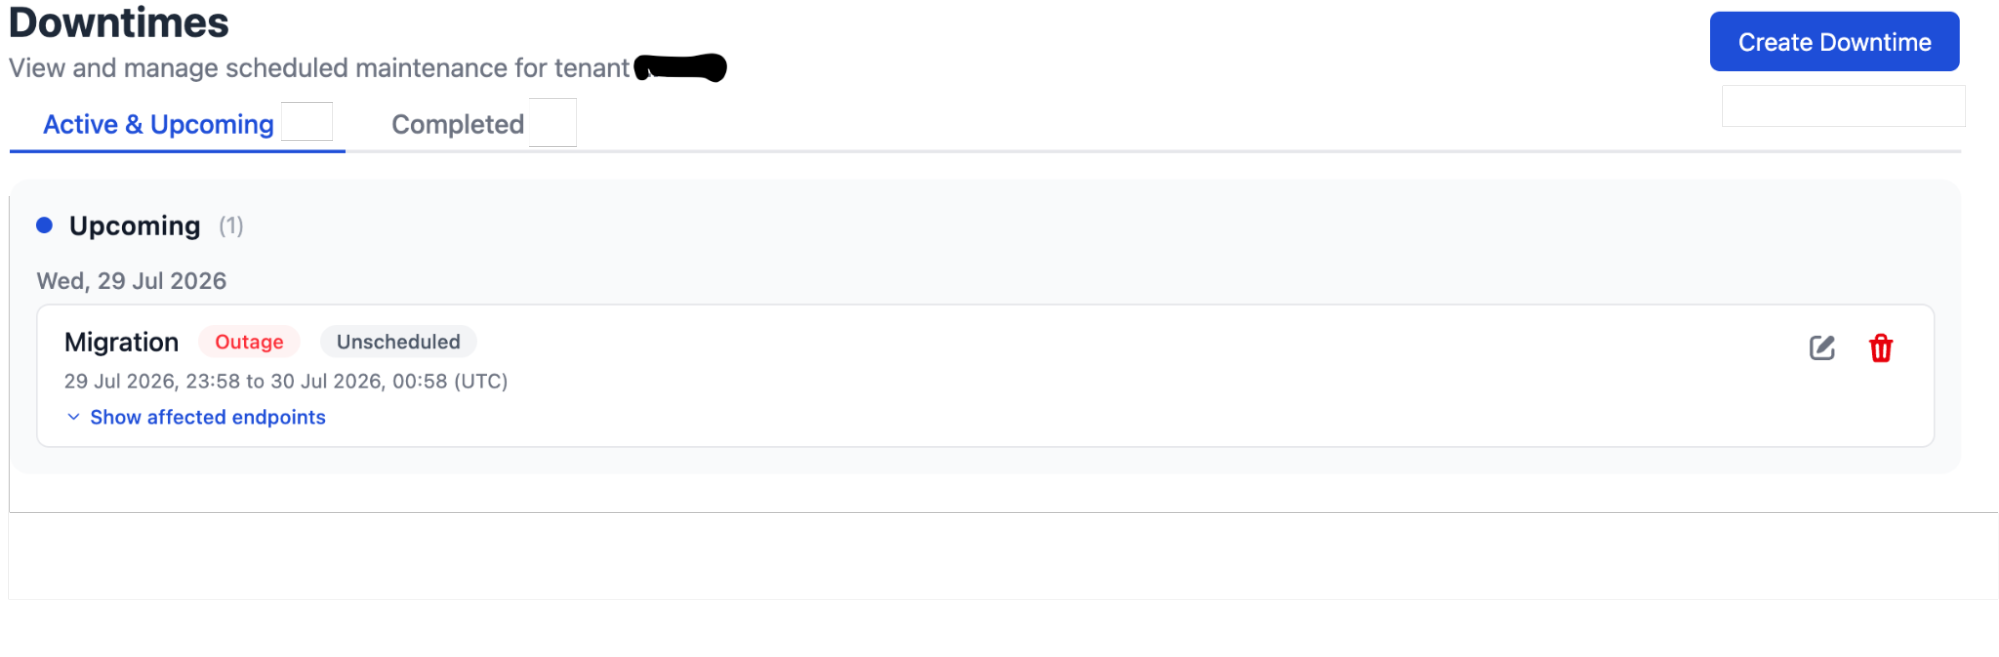
Apart from the upcoming downtimes there is also the completed section of the downtime with the same information. If you are looking for a downtime within a specific period, you can use the date filter located in the top-right corner of the page to narrow the results.
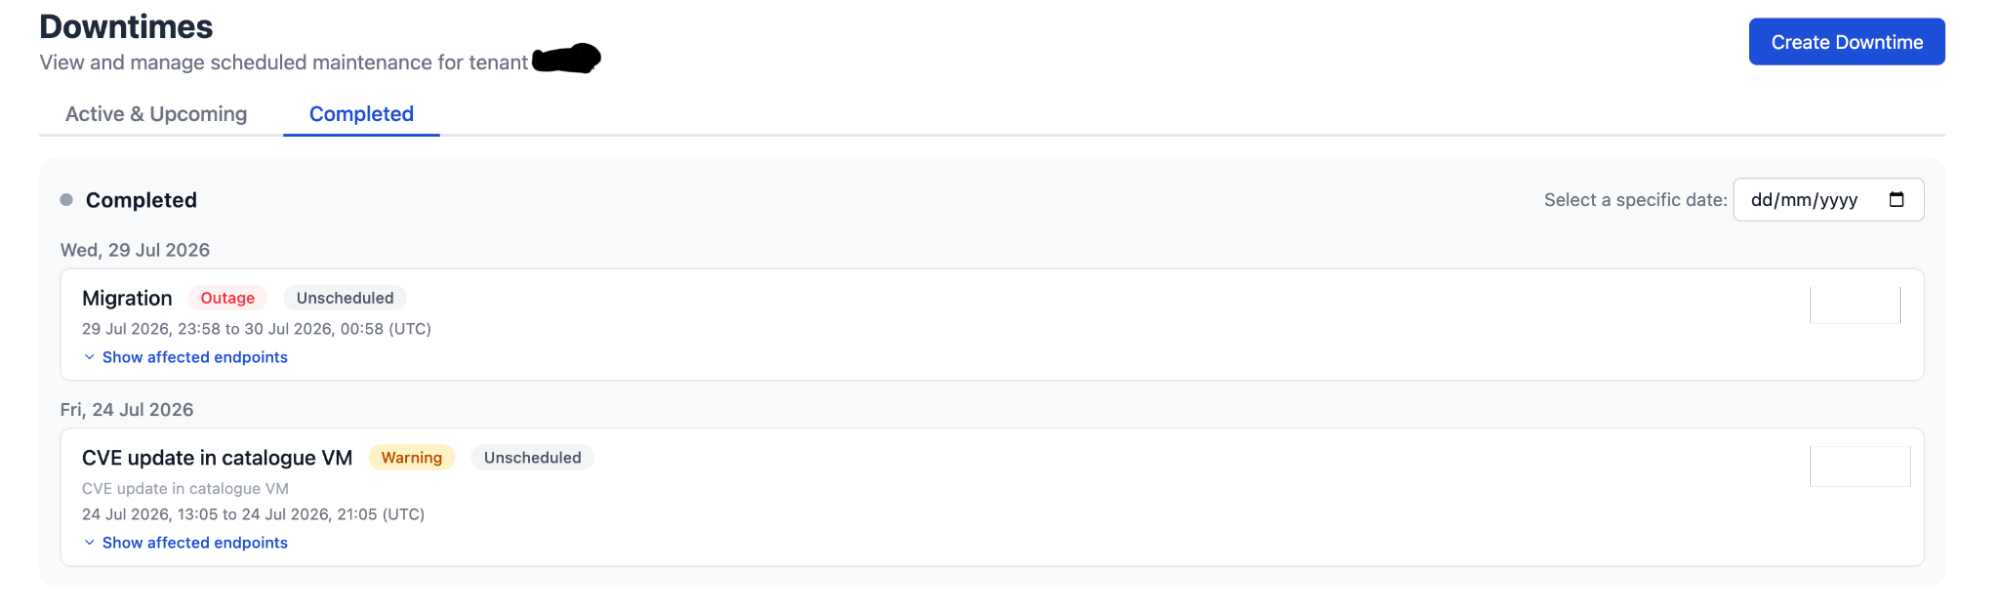
Note: Please note that once a downtime has been marked as completed, it can no longer be modified or deleted.
Note 2: Please note that once a downtime has been marked as running, it can no longer be modified or deleted.
Create a downtime
| This action can be performed by both Super and Tenant Administrators and any user with access to a Tenant in Argo Monitoring Service, assigned with a role that is allowed to perform this action. |
|---|
To create a new downtime, click the Create button and complete the following fields:
- Name – A short, descriptive title for the downtime or maintenance event.
- Severity – Select either Outage or Warning. This indicates the impact level of the event.
- Message – A detailed description providing additional information about the downtime.
- Scheduled At – The date and time when the downtime is scheduled to begin.
- Completed At – The date and time when the downtime ended or is expected to end. This field can also be updated once the downtime has been completed.
- Services – Select the service(s) affected by the downtime.
After completing the required fields, click Create to add the downtime.
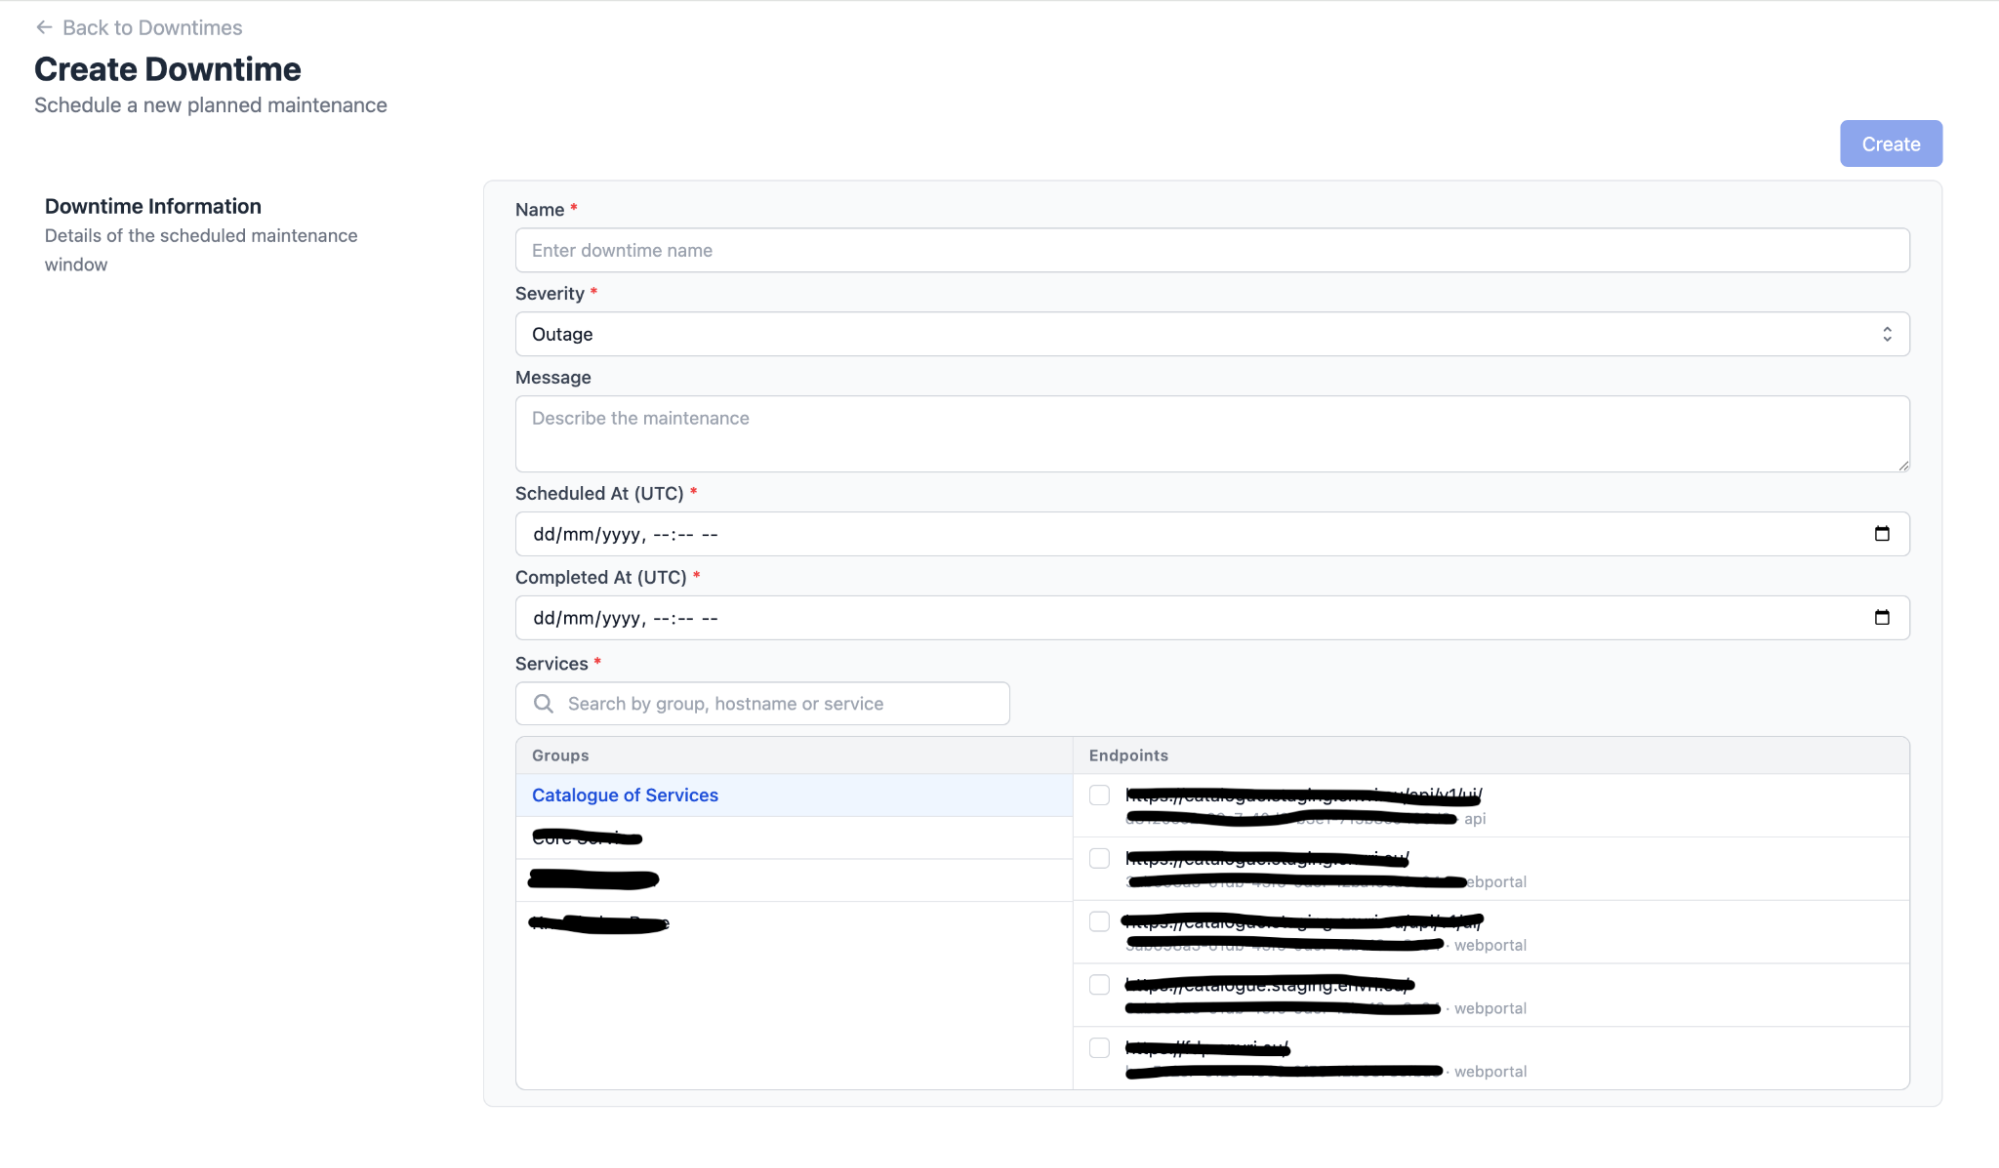
If a service endpoint belongs to multiple groups and you select only one of those groups when creating a downtime, the system displays a notification similar to the following:
This endpoint also exists in groups: "GROUP-10", "GROUP-2". It will be marked as affected in all of them, not just in group "CESSDA".
This means that the downtime is applied to the selected service endpoint across all groups in which that endpoint exists. As a result, all affected groups will display the downtime, not only the group that was originally selected.
Update a downtime
| This action can be performed by both Super and Tenant Administrators and any user with access to a Tenant in Argo Monitoring Service, assigned with a role that is allowed to perform this action. |
|---|
In the list of the downtimes, the user may click the edit button in order to edit the downtime. The action is similar to the Create action.
Places with downtimes info
Dashboard
The Dashboard also includes a Downtimes banner that provides an overview of all ongoing and upcoming downtimes for the tenant, as shown in the image below. For more details, see the Downtimes section.

Hover over the banner to view the services currently affected by downtime, along with the scheduled start and end times for each downtime period.