Topology Configuration & Management
The Topology section allows tenant_administrators to define and manage a set of monitored items for their tenant. This is the foundation of the monitoring system: before any status results, health reports, or alerts can be produced, the service must know what to monitor.
This document covers the concepts behind topology management, the recommended configuration workflow, and a full walkthrough of the corresponding topology section in our UI.
| 🔑Access requirement: You must have the tenant_admin or super_admin role to create, edit, or delete topology items. |
|---|
Core Concepts
Why topology is required
Monitoring a system means knowing what is being observed and how those things are identified. Without this knowledge, the service has no foundation from which to produce meaningful results. Before the monitoring engine can track status, surface alerts, or report on the health of your environment, it needs a structured description of that environment: the items it should watch and how they are organized. This description is what you declare as a topology.
Think of the topology as the map your monitoring system reads from. Every result the service surfaces is correlated to an item on that map. If an item has not been declared, the system has no record of its existence and cannot monitor it. For this reason, topology declaration is the required first step before any monitoring results become available.
Endpoints
An endpoint is the fundamental unit of the topology. It represents a single monitored item (a service/resource/host) identified by a unique service name and a URL. When an endpoint is declared, the service begins tracking its availability and health at the specified address.
Each endpoint has the following properties:
- Type: The category or type of the service being monitored (it is a predefined dropdown list for every customer. An example could be a webpage, or a webapi.).
- URL: The address the service checks when monitoring this endpoint.
- Labels: Optional free-text tags for filtering and organizing endpoints.
- Group: Endpoints are organized in groups. Every endpoint must be assigned to at least one group. Here you must select the group from the list of groups that already exist or create a new one. The group this endpoint belongs to.
- Friendly Name: A human-readable name used to easily identify the endpoint in the interface. It can be used to describe the monitored service in a more recognizable way than its URL, for example, "Helpdesk Web Portal".
- Monitored: Whether active monitoring is enabled for this endpoint. Can be toggled on or off.
- Notifications: Whether email notifications are sent when this endpoint's status changes.
- Metadata: Optional custom key-value pairs for storing additional information about the endpoint (ex. service_name: Helpdesk).
Groups
A group is a logical container that organizes related endpoints together. Groups make it easier to manage large topologies and to configure shared notification settings for a set of related services. They also are used to represent larger abstractions such as service offerings that consist of different components. Each group has a name and an optional list of contact email addresses. When notifications are enabled at the group level, the service sends alerts to those addresses when any endpoint in the group changes status. Groups can be created either before endpoints, or inline during the endpoint creation process.
Topology Feed
A topology feed is the data source the service uses to populate the topology. It determines whether endpoints and groups are managed manually or synchronized automatically from an external source. There are two approaches:
- Internal feed: Endpoints and groups are entered manually through the Topology UI. This gives you full control over what is monitored and how it is organized.
- External feeds: Endpoints and groups are imported automatically from an external source (a URL, a CSV file, or a third-party service catalog). The service fetches and synchronizes the topology from that source, so the Endpoints and Groups tabs reflect the imported data.
The feed type is configured first, before any endpoints or groups are declared, as it determines how the rest of the topology is managed.
Configuration Workflow
The recommended workflow for setting up a topology is:
- Configure the feed: Go to the Feed Configuration tab and select the feed type. If you are managing endpoints manually, select Internal. If you are importing from an external source, select the appropriate feed type and provide the required URL(s).
- Create groups: If using an Internal feed, go to the Groups tab and create the groups that will organize your endpoints. You can also create a group inline when adding an endpoint.
- Add endpoints: Go to the Endpoints tab and add each monitored item, assigning it to a group and configuring its monitoring and notification settings.
If you are using an External feed, steps 2 and 3 are handled automatically. The Endpoints and Groups tabs will reflect the items imported from the configured source.
User Interface
The Topology page is accessed from the tenant administration area by clicking the Topology menu item from the sidebar. It contains four tabs: Endpoints, Groups, Feed Configuration, and Documentation.
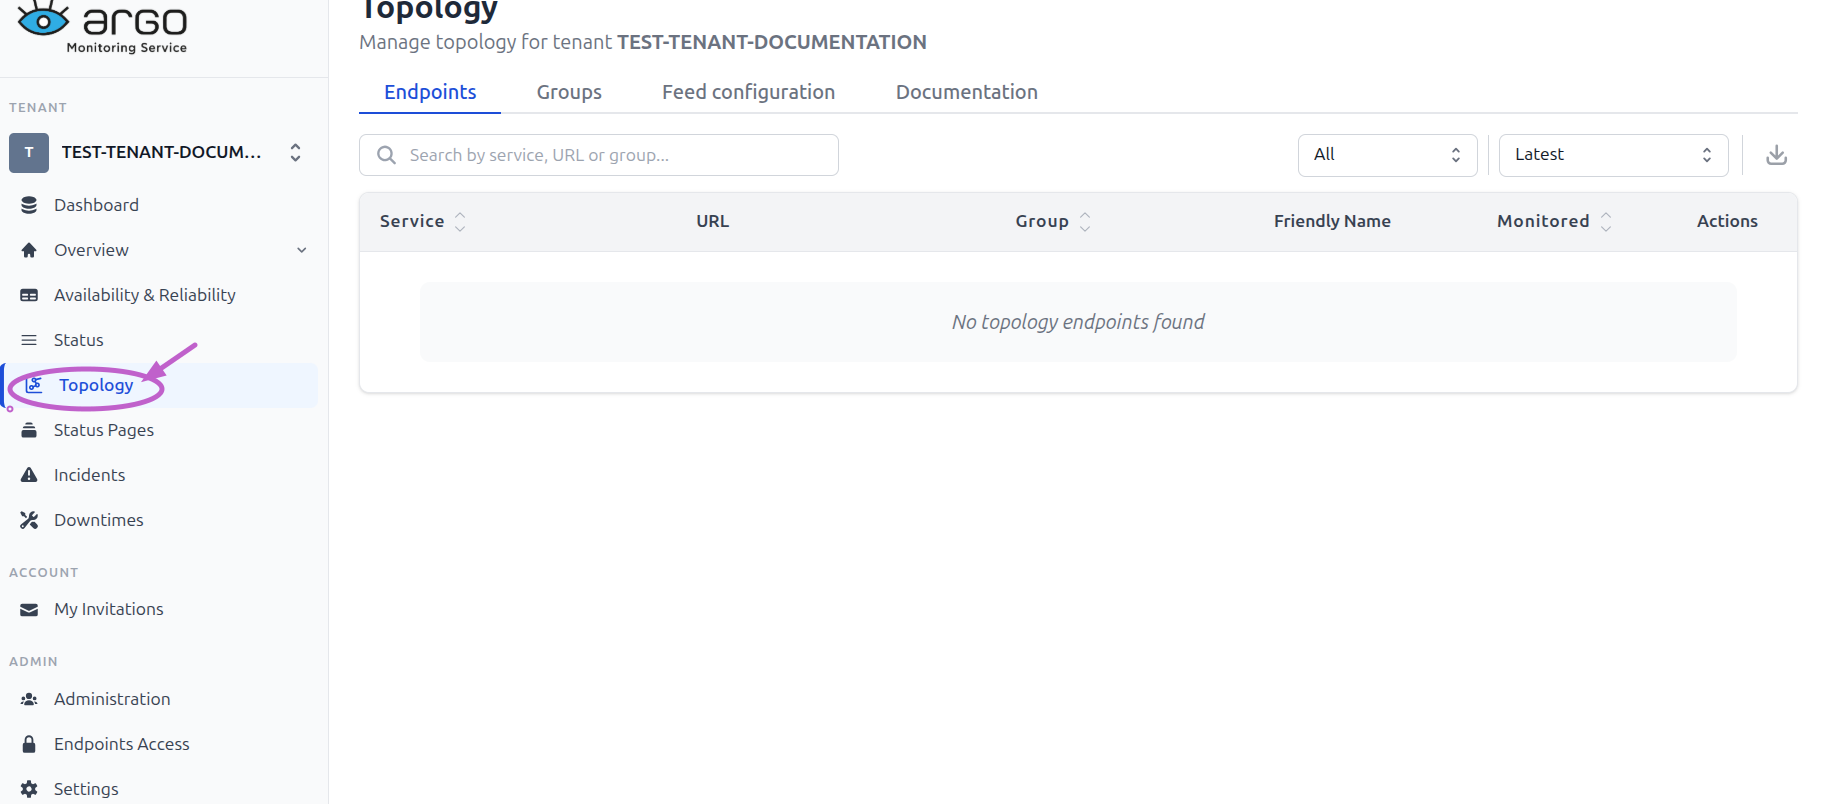
Selecting from the sidebar menu Topology on a new tenant
Feed Configuration Tab
The Feed Configuration tab is where you define how topology data enters the system. It should be configured first, before adding any endpoints or groups. The tab contains a single Topology Feed section with a required Type field. Selecting a type may reveal additional fields depending on the source:
- Internal: When Internal is selected Endpoints and groups are managed entirely through the Topology UI by the tenant administrator. Use this type when you want full manual control over what is monitored.
- External: When External is selected the service connects to a predefined external source associated with the tenant.
- CSV: When CSV is selected the user is asked to enter the URL of a CSV file that contains the topology data. The service will fetch and import endpoints and groups from that file.
- Desy Marketplace: When Desy Marketplace is selected the user is asked to enter the URL of the Desy Marketplace feed from which the topology will be synchronized.
- EOSC Service Catalog: When EOSC Service Catalog is selected, the user is asked to fill three URLs for getting the service groups, endpoints and the extension data.
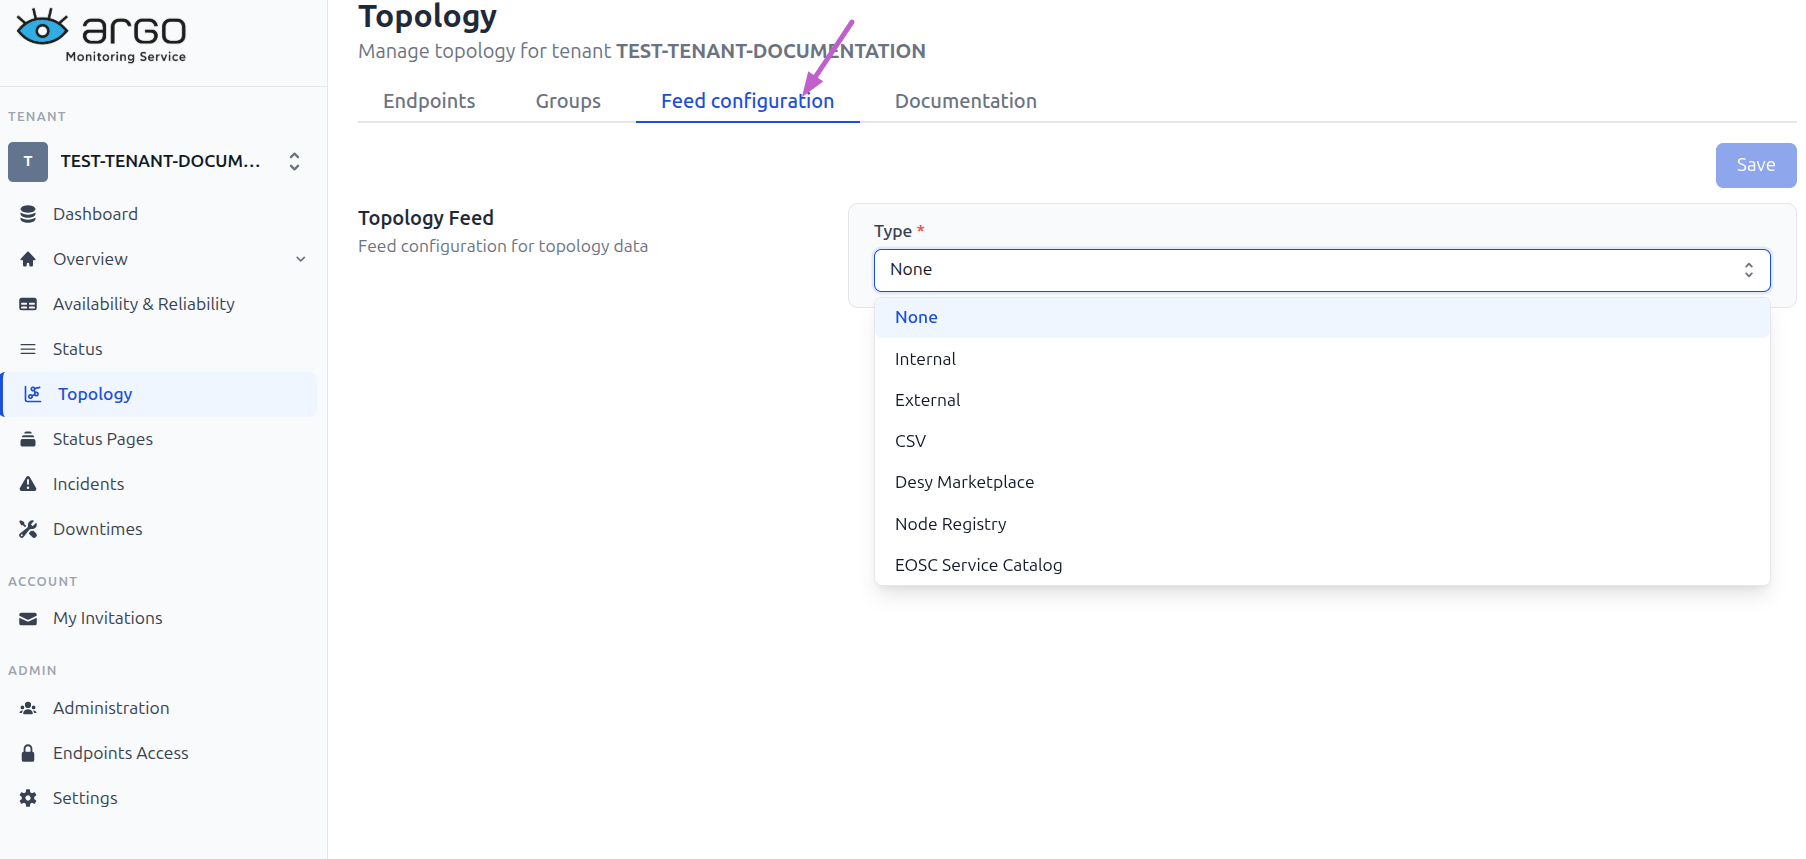
Selecting the Feed configuration tab and then selecting a topology feed type through the available options
After selecting the feed type and entering any required URLs, click Save to apply the configuration.
Groups Tab
The Groups tab lists all groups defined in the tenant's topology. Each row displays the group name, the associated contact emails (if any), and action controls to edit or delete the group. The tab includes a search field for filtering groups by name and a date selector. The date selector is important because it allows you to view changes captured in the topology day by day. Today's date (Latest) is always preselected by default but you can go back in time.
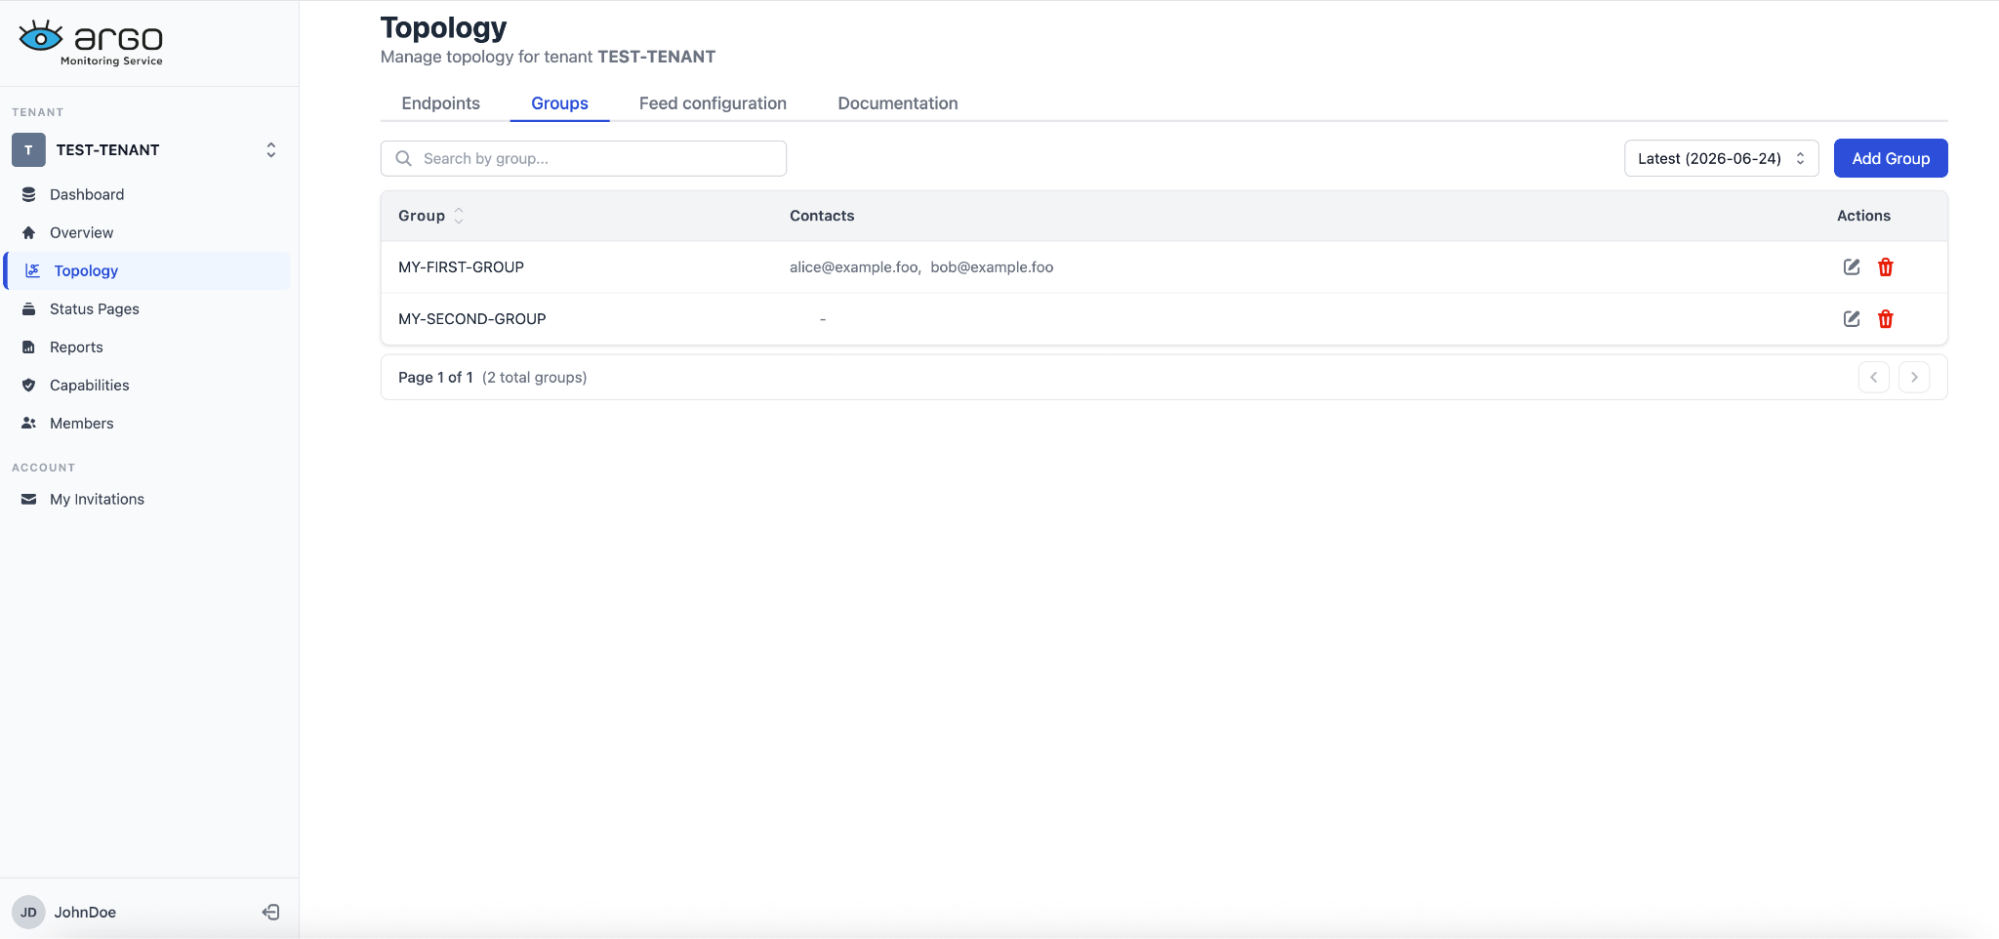
Viewing the topology groups of the tenant (example)
Adding a Group
Click Add Group in the top-right corner of the tab to open the Add Topology Group form.
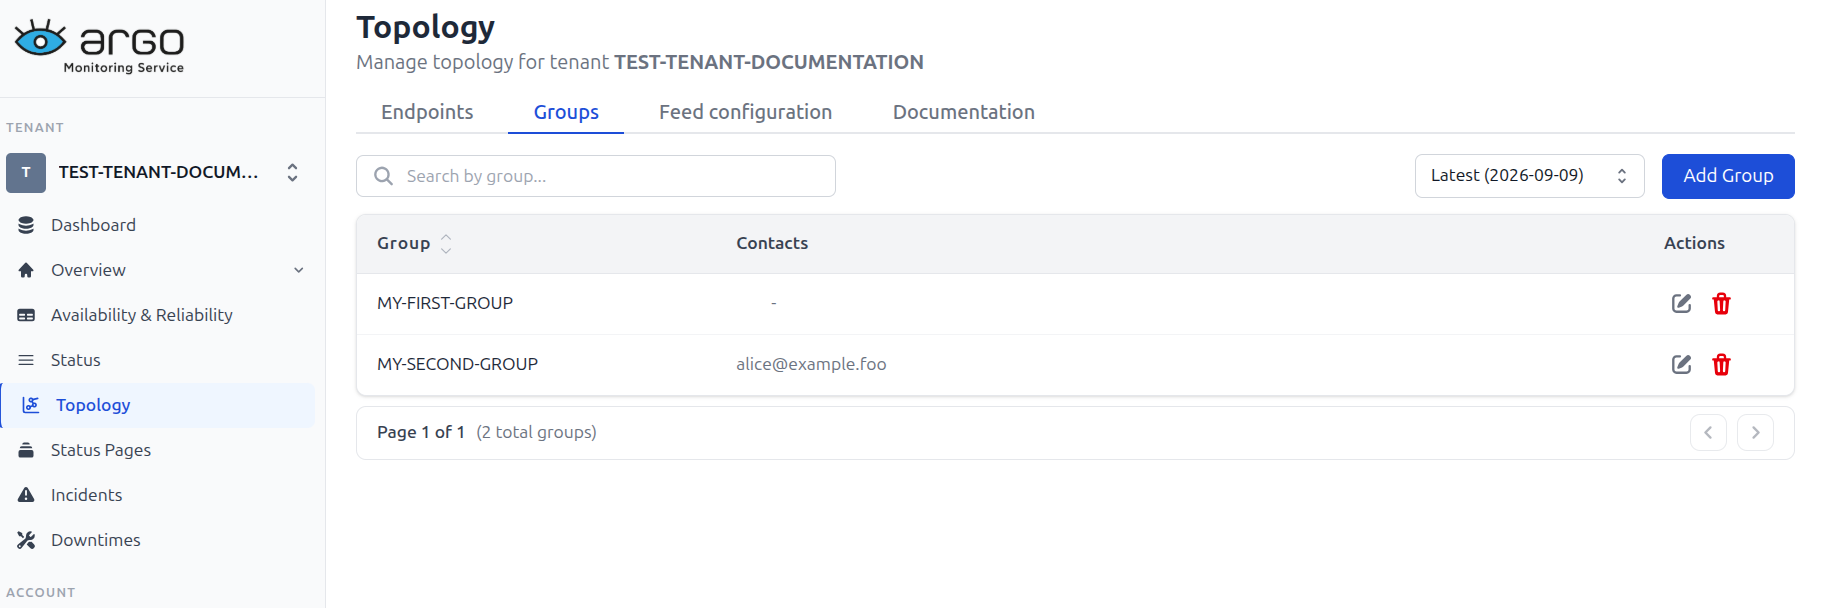
Selecting the Add Group button to add a new group
The form contains two sections:
- Group Details: Enter a Group name. This is the only required field and serves as the unique identifier for the group within the tenant's topology.
- Notifications: Toggle notifications on or off for this group. When notifications are enabled, a Contact Emails field appears. Enter one or more email addresses that will receive alerts when the status of any endpoint in this group changes. Additional addresses can be added by clicking Add another email.
Click Add Group to save the new group. Click Back to Topology to return to the Groups tab without saving.
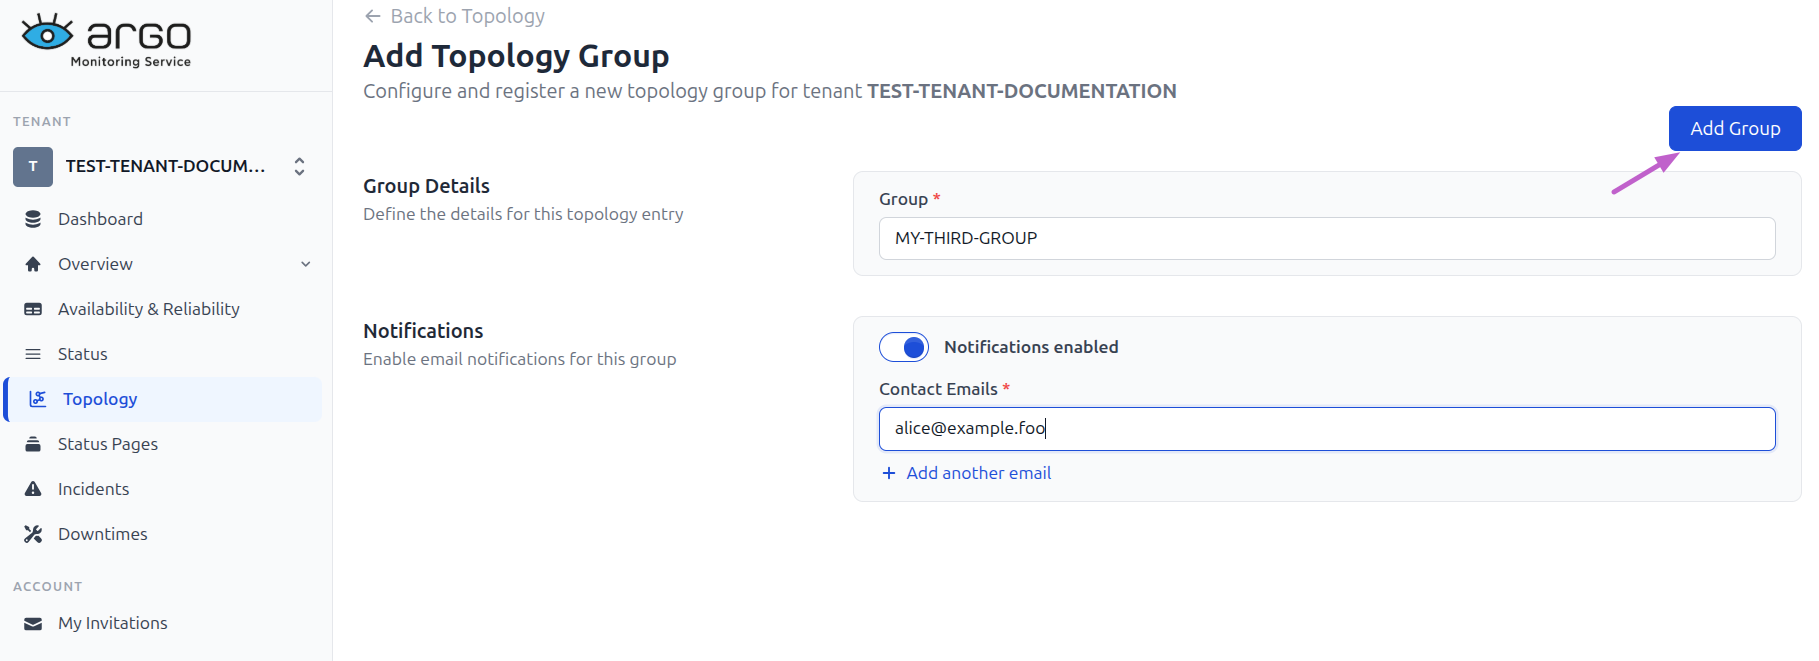
Filling in the group details and notification info and clicking Add group to add a new group to the tenant
Editing or Deleting a Group
Each group row in the list has two actions::
 Edit: Opens the group form pre-filled with the existing values, allowing you to update the name or notification settings.
 Delete: Permanently removes the group. Ensure no endpoints are assigned to the group before deleting it.
Endpoints Tab
The Endpoints tab lists all endpoints in the tenant's topology. Each row displays the service name, URL, assigned group, monitoring status, and action controls. The tab includes a search field for filtering endpoints by service name, URL, or group, as well as a dropdown to filter by group and a date selector. The date selector is important because it allows you to view changes captured in the topology day by day. Today's date (Latest) is always preselected by default but you can go back in time.
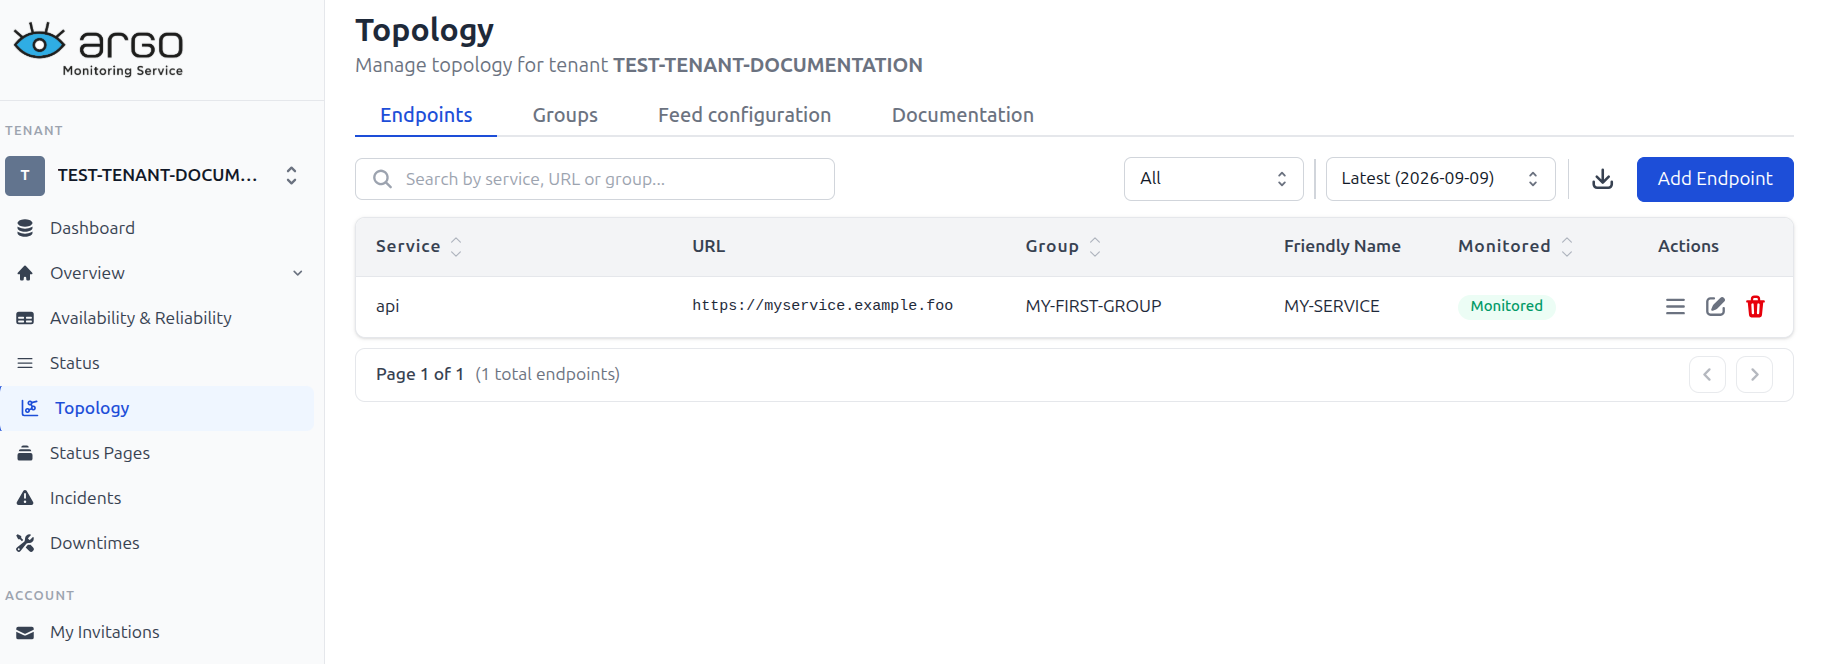
Viewing the tenant's available topology endpoints through the Endpoints tab
Adding an Endpoint
Click Add Endpoint in the top-right corner of the tab to open the Add Topology Endpoint form.
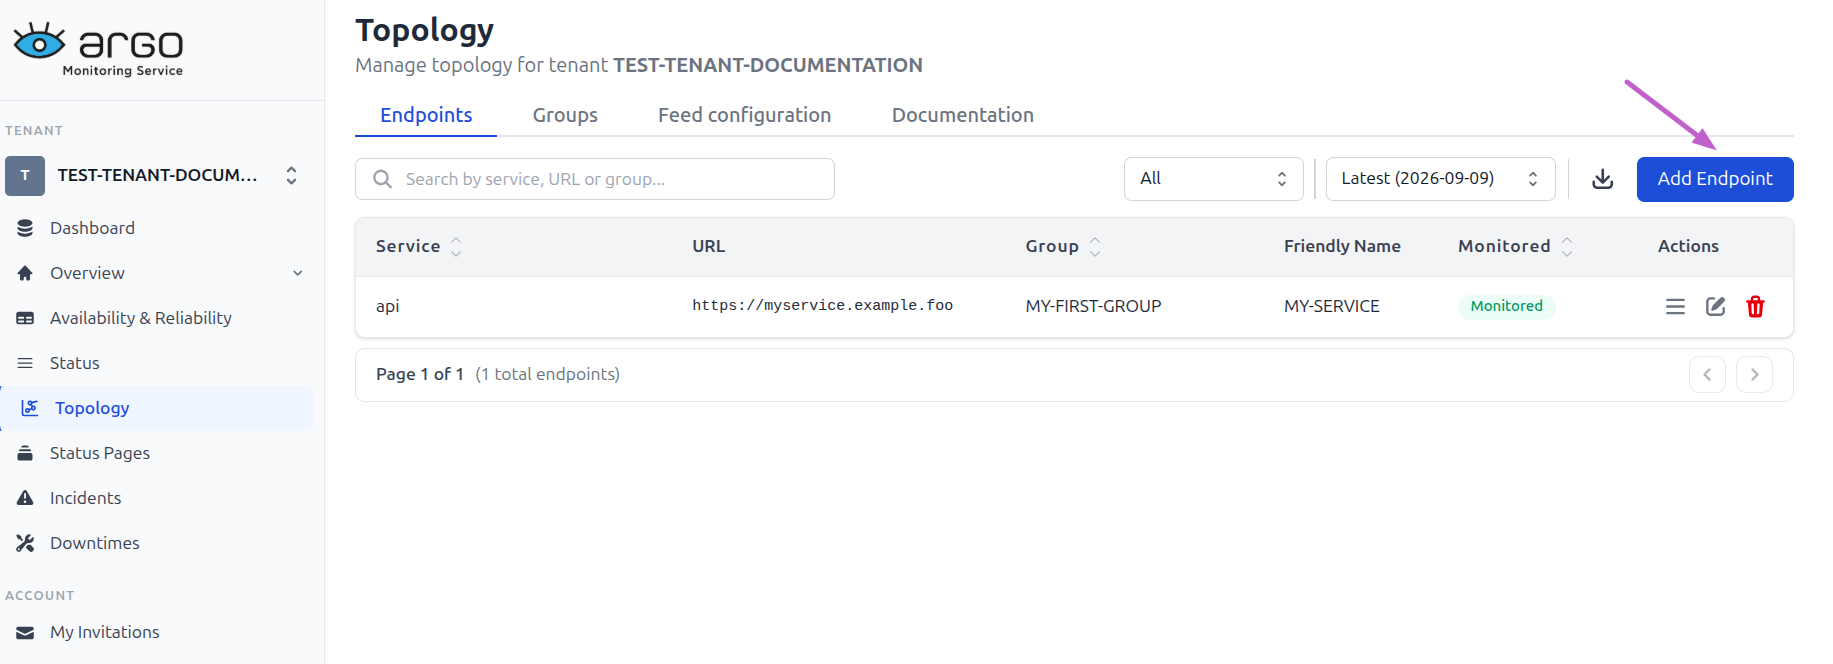
Selecting Add Endpoint button to add a new endpoint in the topology
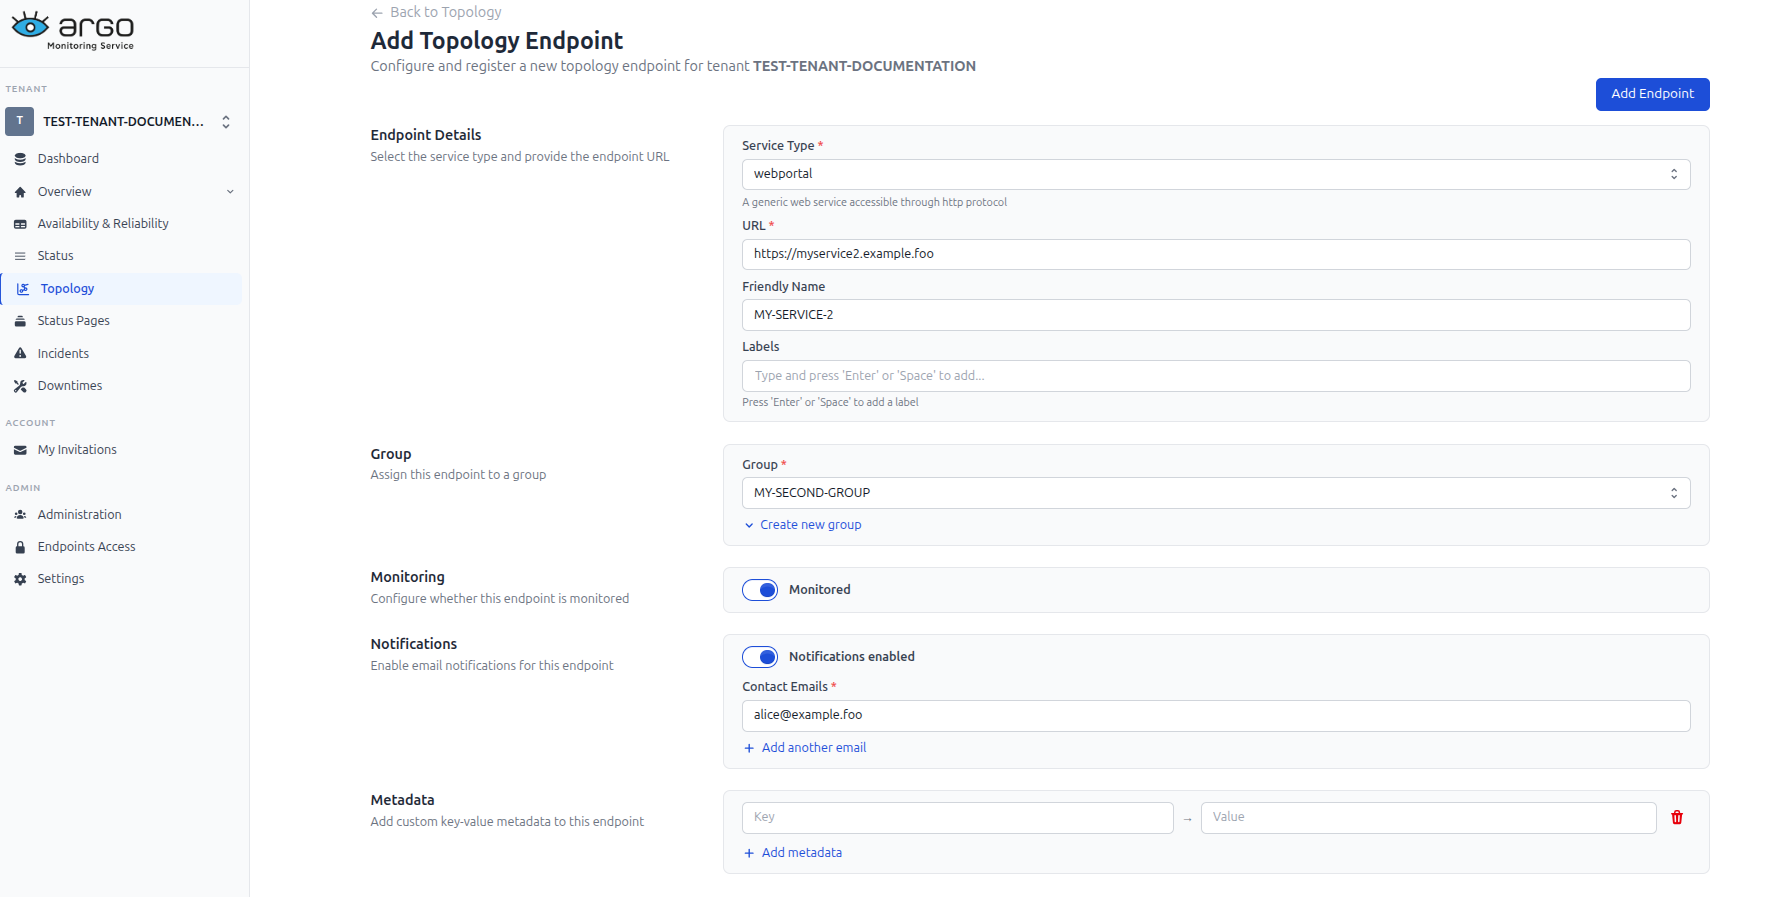
Filling in information about a new endpoint
The form contains the following sections:
- Endpoint Details:
- Service Type: User must select a service type of the ones available that correctly represents the type of the endpoint for example if its a simple webpage (webportal) or a json api (api) or an identity management service (iam)
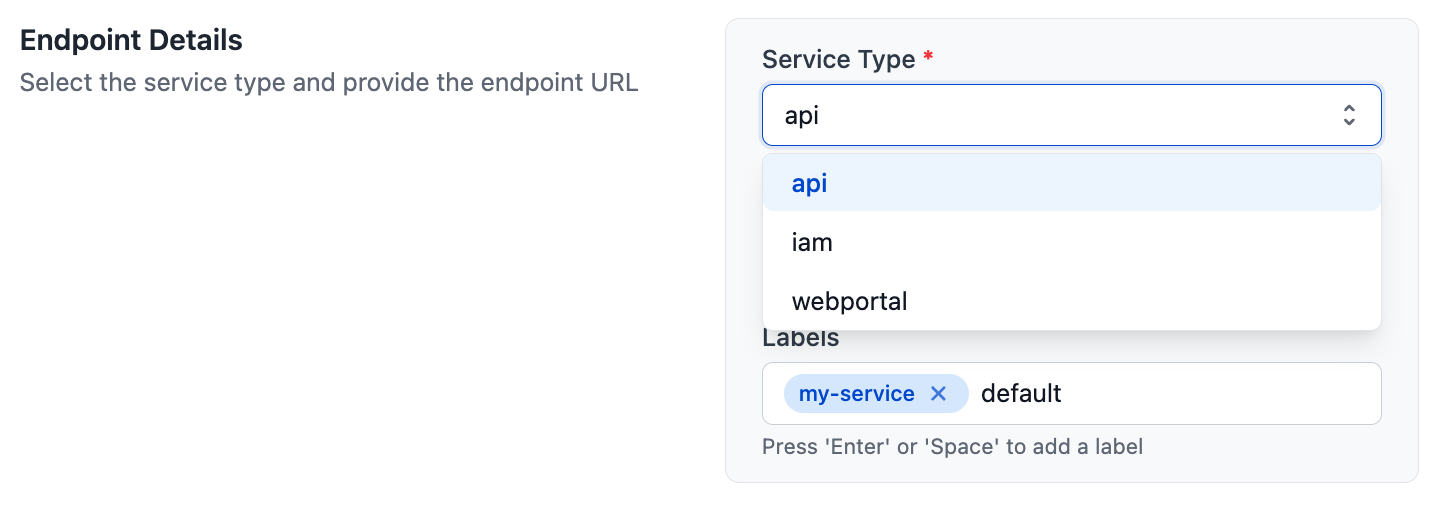
Dropdown showing available service types. These are the default ones but the system can configure more per tenant - URL: The url where the endpoint resides
- Friendly Name: The human-readable name of the endpoint
- Labels: A comma separated list of words that can be used to categorize endpoints when filtering (like tags)
- Service Type: User must select a service type of the ones available that correctly represents the type of the endpoint for example if its a simple webpage (webportal) or a json api (api) or an identity management service (iam)
- Group: The user is asked to select an existing group from the Group dropdown to assign the endpoint to it. If no suitable group exists yet, the user can click the Create new group to create one without leaving the form.
- Monitoring: the User can toggle the Monitored switch to enable or disable active monitoring for this endpoint. Monitoring is enabled by default. When disabled, the service does not check the endpoint and no results are generated for it.
- Notifications: the user can toggle the Notifications switch to enable or disable email alerts for this endpoint. When enabled, notifications are sent according to the contact settings defined on the assigned group.
- Metadata: the user can attach custom key-value pairs to the endpoint. Metadata is optional and can be used to store additional context for the specific endpoint.
Click Add Endpoint to save. Click Back to Topology to return to the list without saving.
Viewing , Editing or Deleting an Endpoint
Each endpoint row has two actions::
 View : Views the endpoint form pre-filled with the existing values.
- Edit : Opens the endpoint form pre-filled with the existing values.
- Delete: Permanently removes the endpoint from the topology. The service will stop monitoring it immediately.
Documentation Tab
The Documentation tab is meant to provide quick reference material for the Topology Managements features directly within the interface.