Performance
Knowing that a service is available does not always mean that it is performing well. A service may be operational and successfully respond to monitoring checks while still experiencing slow response times, increased resource consumption, or gradual performance degradation. Performance monitoring complements availability and reliability monitoring by providing visibility into how well a service is operating over time.
ARGO Monitoring Service supports performance monitoring by continuously collecting performance-related information from the monitoring metrics that report it. This may include network connection and response times, CPU load, memory and process usage, disk usage, and other measurements that provide insight into the behaviour and resource consumption of a service.
While availability and reliability monitoring primarily answer the question “Is the service working?”, performance monitoring addresses a different question: “How well is the service working, and is its performance changing over time?”
By collecting performance information over time, ARGO Monitoring Service can provide a broader view of service behaviour. Historical performance data makes it possible to identify trends, detect gradual degradation, recognize unusual changes in resource consumption, and identify potential bottlenecks before they escalate into service-impacting problems.
Performance information is derived from the actual data[^3] reported by monitoring metrics. Actual data provides additional information about the behaviour of a service alongside the standard monitoring result. The reported performance values are stored and processed so that they can be presented as graphs and time-series data in the ARGO Monitoring Service UI.
It is important to note that not every monitoring metric provides performance data. Performance data is explicitly reported by the metric scripts developed by service owners and developers. Therefore, performance monitoring is an opt-in capability at the metric level: only metrics that have been designed to report actual data can contribute performance information.
This approach ensures that the performance information exposed by ARGO is meaningful and relevant to the service being monitored, while giving service developers control over which aspects of service behaviour are measured and made available for analysis.
Core Concepts
Why Use Performance Monitoring?
Performance monitoring provides information that cannot be obtained from availability and reliability monitoring alone. It helps service administrators understand the quality of service operation and make informed decisions based on how services behave over time.
-
Detect issues before they affect users — performance changes can provide early indications of problems, allowing administrators to investigate and address them before they result in service degradation or outages.
-
Gain visibility into service behaviour — performance data provides a continuous view of how a service operates, making it easier to understand normal behaviour and recognize significant changes over time.
-
Support informed operational decisions — historical performance information can help administrators make better decisions about resource allocation, capacity, scaling, and service optimization.
-
Provide additional context for troubleshooting — performance information complements availability and reliability data when investigating incidents, helping administrators understand the conditions surrounding a problem and how the service behaved before, during, and after it occurred.
-
Enable proactive service management — by monitoring performance trends rather than reacting only to service failures, administrators can identify potential risks and take action before they become user-impacting problems.
View in the UI
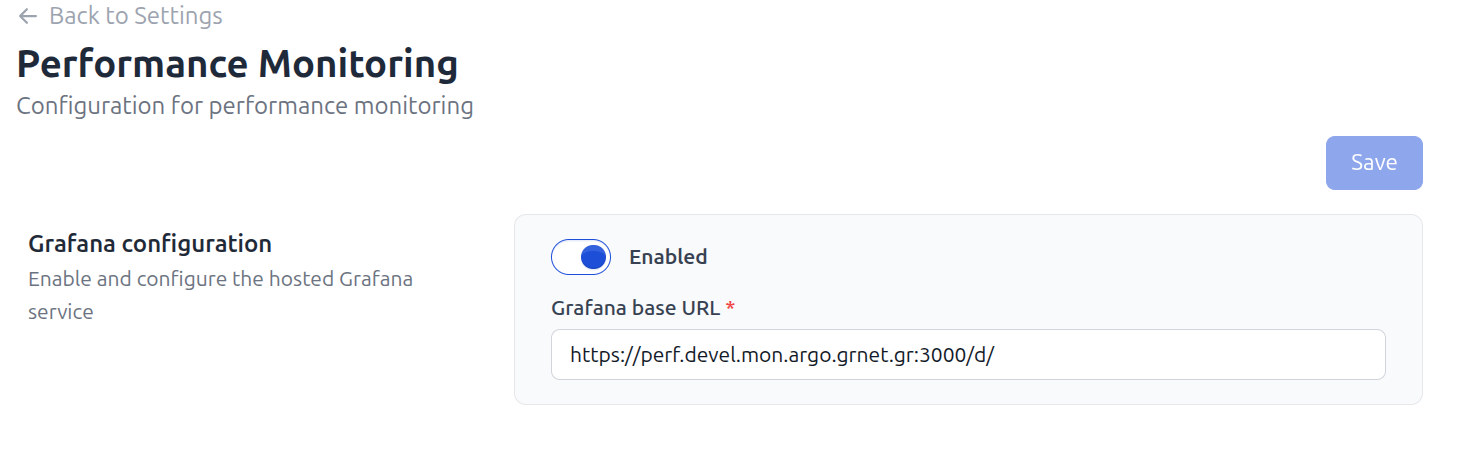
Performance data is available through the Performance dashboard, where service performance can be visualized over time using graphs and time series.
- Filter performance data — select a specific group or service to focus on the performance information relevant to your analysis.
- Explore performance over time — select a time range and use the time-series graphs to observe changes, trends, and variations in service performance.
- Compare metric values — each performance metric provides summary values, including the latest, minimum, and maximum observed values for the selected period.
Monitor the latest information — refresh the dashboard to retrieve the most recent available performance data.
Enabling Performance Monitoring
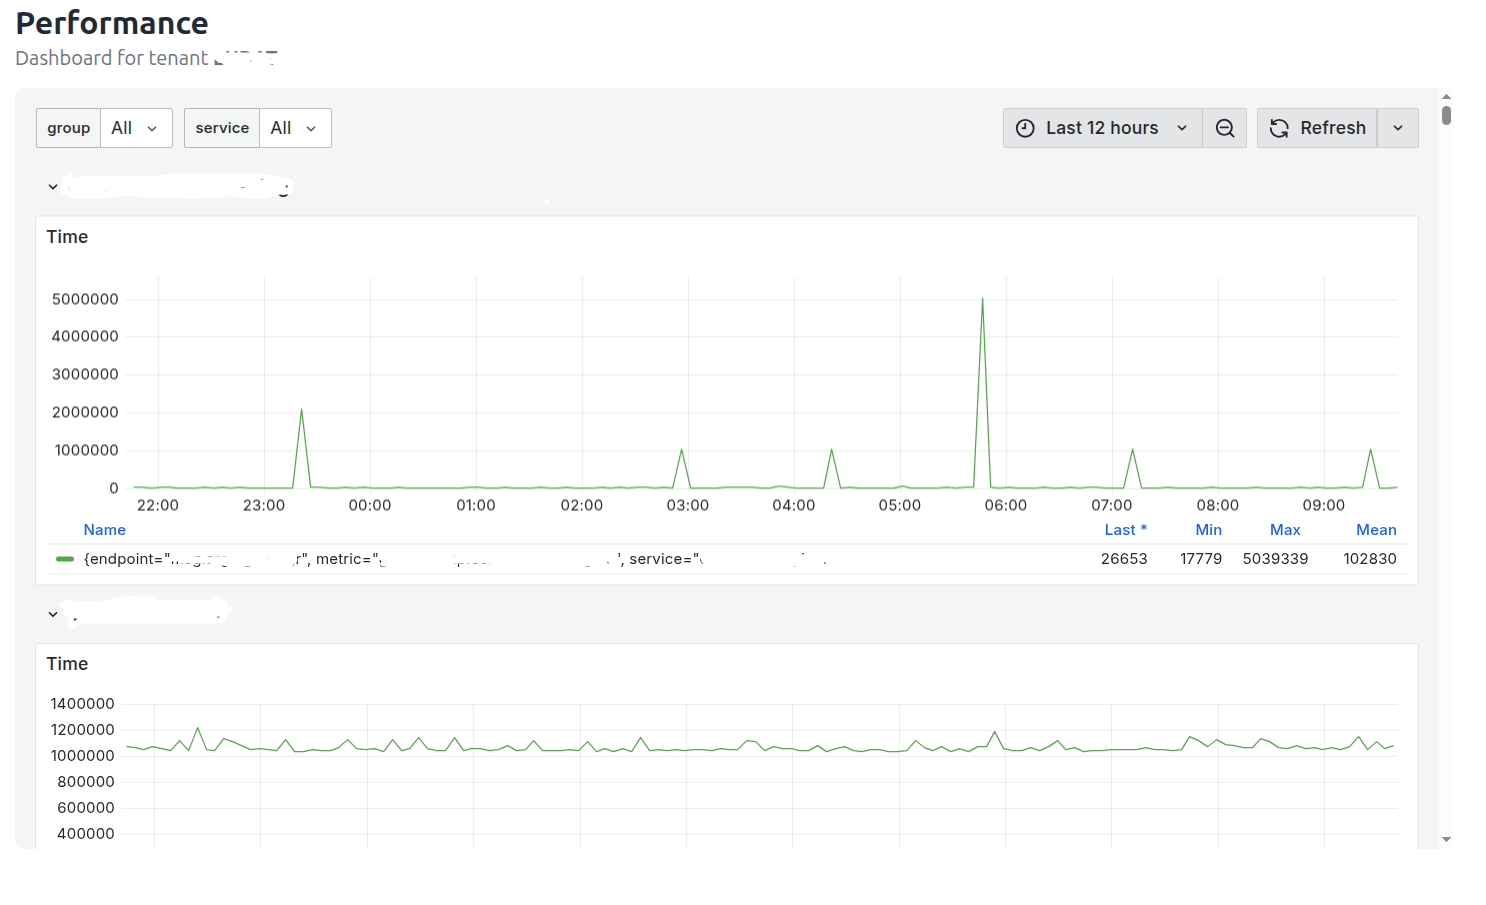
Performance monitoring can be enabled or disabled independently for each tenant. This allows service providers to decide which tenants should have performance data collected and displayed.
To configure performance monitoring for a tenant:
- Go to Administration.
- Select Edit Tenant for the tenant you want to configure.
- Open the Infrastructure Settings tab.
- In the Performance section, use the Enabled toggle to enable or disable performance monitoring for the tenant.
- Select Update to save the configuration.
When performance monitoring is enabled, performance data is collected and made available through the Performance dashboard. When it is disabled, performance monitoring is not enabled for that tenant.
Configure Performance Monitoring
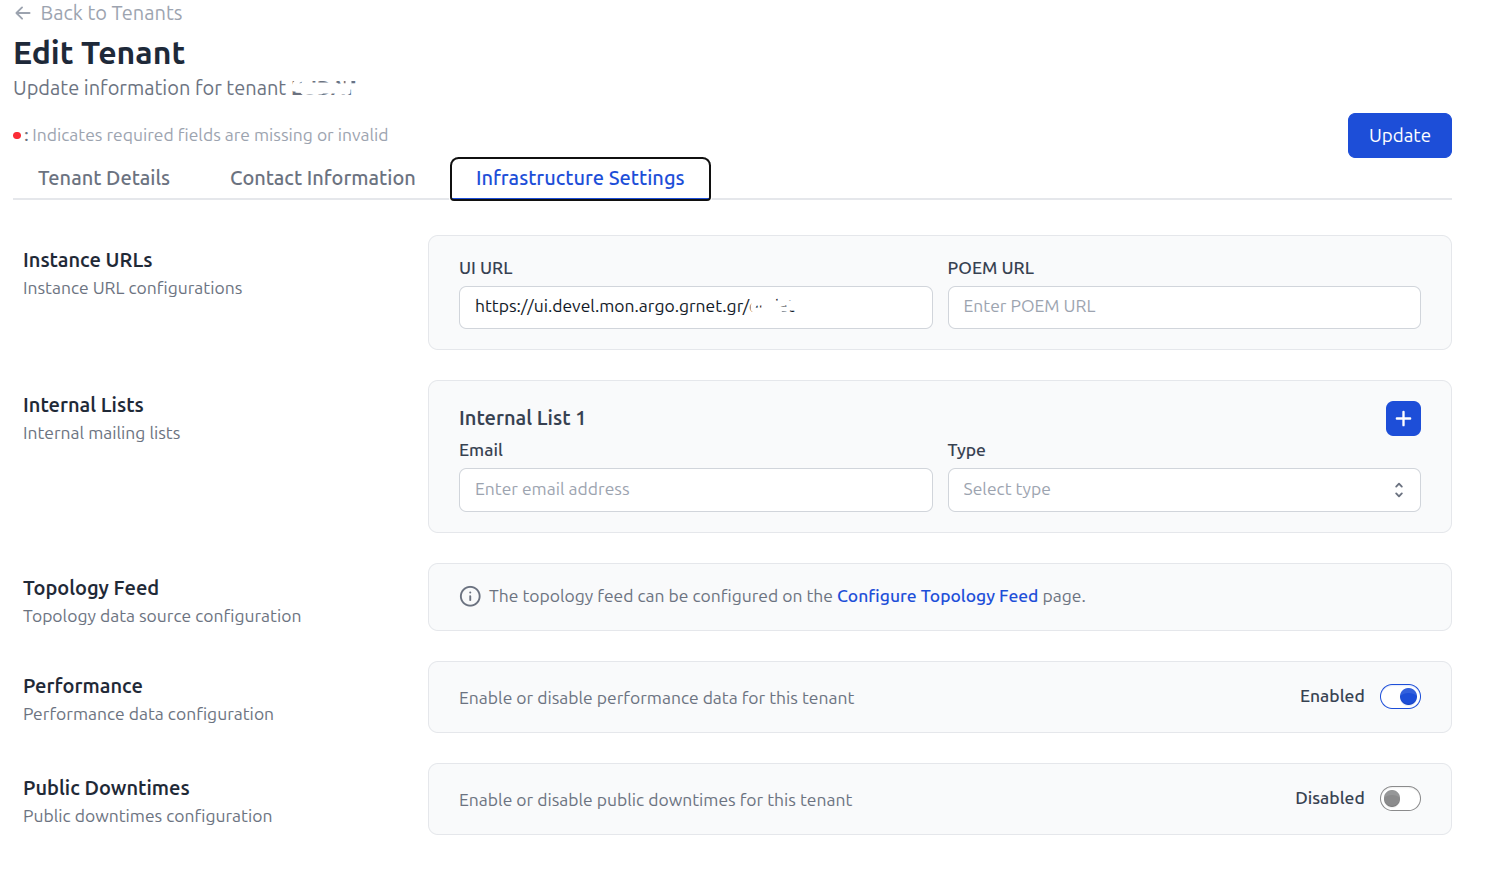
Each ARGO Monitoring Service instance must be configured with the URL of the Grafana instance that provides the Performance Monitoring dashboards. Grafana is an open-source observability and visualization platform that presents monitoring metrics and performance data through interactive dashboards, graphs, and charts.In ARGO Monitoring, Grafana dashboards allow users to analyze historical and real-time performance data for monitored services and tenants.
To configure the Performance Monitoring URL:
-
Navigate to Settings → Performance Monitoring.
-
Click Performance Monitoring to open the Grafana Configuration page.
-
Set the Enabled option to enable Performance Monitoring.
-
Enter the Grafana Base URL.
-
The Grafana Base URL specifies the base address of the Grafana instance that ARGO-Mon uses to construct the URLs for the performance dashboards of individual tenants. For example: https://perf.devel.mon.argo.grnet.gr:3000/d/
The configured base URL is used as the starting point when generating the dashboard URL for each tenant.