Capability
The Capability option allows tenants to configure whether they participate in the monitoring activities of an EOSC Node. This is relevant only for tenants whose organization, infrastructures, and/or services are part of a Node in the EOSC Federation.
What is an EOSC Node?
An EOSC Node is a collection of services and data sources operated as a platform by a national, regional, thematic, or European organisation (or consortium) that provides European researchers with seamless, trustworthy, and secure access to digital resources - FAIR 2 data, software, and services - for conducting research.
Reference: EOSC Association, “EOSC Federation Handbook,” version 2.0, preprint, EOSC Association, January 30, 2026, https://doi.org/10.5281/ZENODO.14999576.
Organizations can participate either by operating an EOSC Node themselves or by onboarding their resources into a Note operated by another organization.
What are Federating Capabilities?
Services enabling or participating in Federating Capabilities are specific services within an EOSC Node (subset of the Node Core Capabilities or of the Node Resources) that allow the Node to enable or participate in Federation-wide activities.
For example, the EOSC EU Node enables the Resource Catalogues and Registry federating capability by operating a central catalogue that collects information about services from all participating Nodes. Other Nodes participate by linking their own Node Core catalogues to this central service. Similarly, Nodes participate in the Authentication and Authorisation Infrastructure (AAI) federating capability by connecting their Node Core AAI to the federation. They can also contribute to the Service Monitoring federating capability by sharing performance and availability information from their Node Core monitoring systems with a federation-level repository.
Enabling the Monitoring Capability
The Service Monitoring Federating Capability, according to the EOSC Federation, has two main objectives:
- Allow the EOSC Federation Governance to verify that the resources delivered by a Node are compliant with the minimum level of quality required by the EOSC Rules of Participation.
- Allow EOSC users to gather information about the quality of the resources via a common set of public metrics/KPIs (e.g. uptime, availability).
For tenants associated with an EOSC Node, the capability can be enabled to expose relevant monitoring information while the tenant continues to operate as an isolated monitoring environment with its own resources, topology, configuration, and access controls.
Currently, the Monitoring Service supports the Metrics capability, which exposes calculated monitoring information for the services associated with the tenant. The available metrics are availability, reliability, and uptime.
These metrics provide a standardized representation of the monitoring results associated with the tenant and can be retrieved through a public API without requiring access to its internal monitoring environment.
View In UI
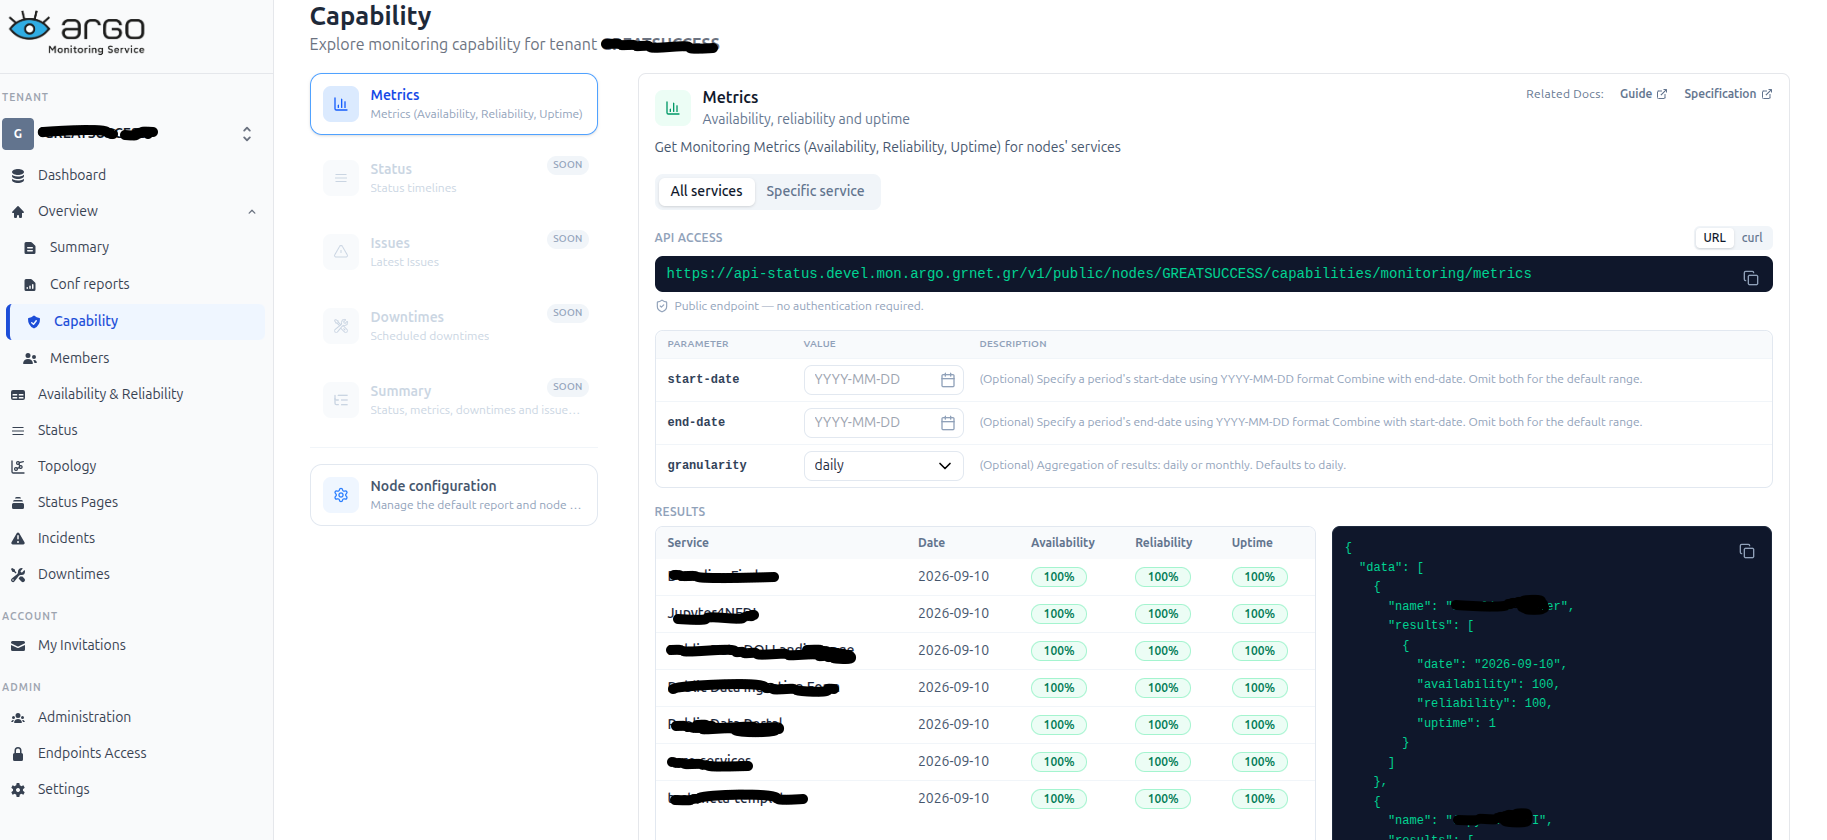
To access the monitoring information exposed through the capability, select the Capability tab from the navigation menu.
As mentioned above, currently the Monitoring Service supports the Metrics capability, and users can choose between:
- All services — displays metrics for all services monitored by the Node.
- Specific service — display metrics retrieved for an individual service.
The results can be filtered by a start date and end date and can also be aggregated by daily or monthly granularity.
The results table displays the service name, date, Availability, Reliability, and Uptime. The corresponding API response is displayed alongside the results, showing the structured data exposed through the capability.
| 🔑Access requirement: The Metrics capability is accessed through a public API endpoint and does not require authentication. |
|---|
Node Configuration
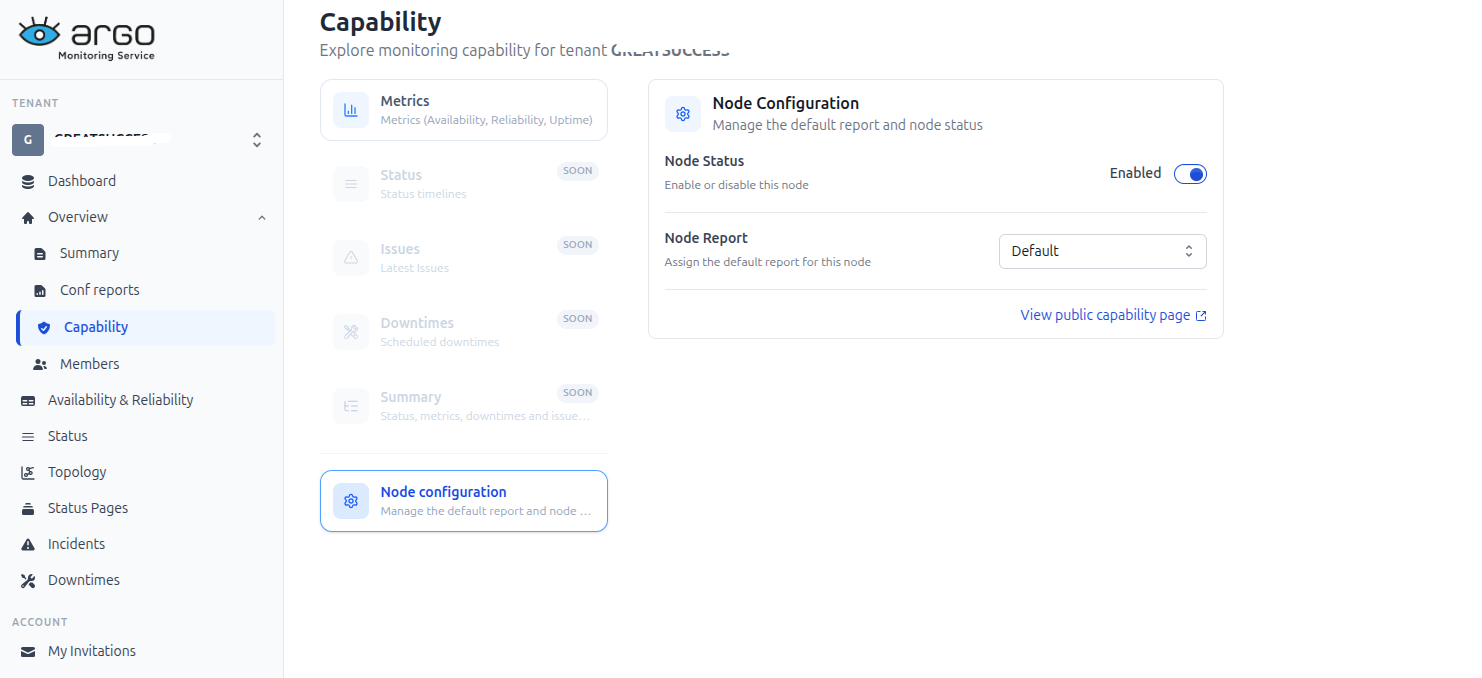
The Node Configuration section provides the settings used to configure the tenant's participation in Node-level monitoring:
- Node Status — enables or disables the Node.
- Node Report — selects the default report associated with the Node.
The selected Node Report determines which report configuration is used when retrieving the tenant's monitoring metrics.